About this article
As the fourth installment of the “Enterprise Architecture” category in the series “Architecture Crash Course for the Generative-AI Era,” this article explains EA-perspective Application Architecture (AA).
While the application-architecture chapter (25 series) handled “internal design of one system,” this article handles “what’s in your company.” For example, “should we integrate dept A’s and B’s systems?” is this article, “how to design the post-integration code” is the 25 series. This article covers application-portfolio management, Buy/Build/Subscribe decisions, integration patterns, and retirement plans - explained for CIO / IT-strategy-department.
Before you read this
This article is mostly about how a whole company's systems should be arranged, so there is comparatively little technical vocabulary. Even so, knowing the basic structure of a web service helps, so if that is unfamiliar, start with the primer "How a Web Service Works". You can also look anything up in the glossary as you read.
What is EA-perspective Application Architecture in the first place
Imagine managing an entire apartment complex. The internal design of each building (floor plans, plumbing) is individual building architecture, but judging “how many buildings are in this area,” “which ones are aging,” and “is it better to build new or renovate” is managing the group as a whole.
EA-perspective Application Architecture (AA) is the domain of drawing a map of all systems running company-wide. While individual system design (25 series) handles “internal structure of one system,” AA surveys “what’s in your company.”
Without AA, double investment in redundant systems and shadow IT proliferate, making company-wide IT assets ungraspable.
The 3rd EA layer (AA) systematizes the structure, relationships, and roles of all applications running company-wide. Different in viewpoint from individual-system design, draw the map of all systems existing in the enterprise.
“Core systems / business systems / SaaS / in-house dev / packaged” - large enterprises run hundreds to thousands of systems. Without grasping the whole picture, redundant investment, integration failures, and shadow IT proliferate. EA’s AA is the foundation of application-portfolio management.
Companies without AA don’t know what they have. Make a map first.
Why AA is needed
It prevents redundant systems and wasted investment. Buying similar systems per department generates hundreds of millions of yen yearly in waste at large enterprises. With AA in place, redundancies can be detected and integrated.
It puts an inventory around ageing systems. “Servers we don’t know are used” / “systems whose authors are unknown” always exist at large enterprises. They eat operational cost and become security holes too. AA is the visualization premise.
It keeps the introduction of new systems consistent. When introducing new systems, without considering integration with existing systems, you fall into integration hell. AA judges company-wide optimum.
AA is built out of a handful of components.
EA’s AA organizes company-wide apps from multiple viewpoints. Beyond mere listing, three-dimensional grasp including relationships, roles, and lifecycle is needed.
| Element | Content |
|---|---|
| Application catalog | List of all systems |
| Function map | Which capabilities are implemented |
| Interface map | Inter-system integration |
| Lifecycle | New, maintain, retire |
| Tech stack | Used languages, FW, DB |
| Operational info | SLA, owner, cost |
Application portfolio — the starting point of AA
The catalog of company-wide systems, the starting point of EA’s AA. Manage with Excel / dedicated tools (LeanIX, Ardoq, etc.), giving basic info to all systems.
| Attribute | Example |
|---|---|
| Name | CRM, SFA, ERP, etc. |
| Class | Core / business / analytics / SaaS |
| Owner | Business dept, IT dept |
| User count | Monthly active users |
| Tech stack | Language, FW, DB |
| Operational cost | Licensing, ops cost |
| SLA | Availability target |
| Lifecycle | New / growth / maintain / retire |
In orgs managing hundreds to thousands of systems, dedicated tools (LeanIX, Ardoq, Mega) become required.
The function map is the next view onto the same inventory.
A map linking BA’s capability map and AA’s apps. Visualize which capability is implemented by which system, discovering gaps, redundancies, and conflicts.
Capability             System
-----------------------------------
Customer mgmt    ----- CRM_A, CRM_B  <- redundant
Sales support    ----- SFA
Inventory mgmt   ----- WMS, ERP      <- redundant
Product planning ----- (none)         <- gap
With redundancies and gaps visualized, integration and new-investment decisions become possible. The ideal state is being able to clearly show “this capability is realized by feature A.”
The interface map shows how those systems are wired to each other.
Visualize inter-system integration (API, file, DB share). When what one system sends and receives becomes clear, impact range and incident propagation can be predicted.
       File                  API
[ERP] ------> [DWH] <------- [EC]  *DWH = Data Warehouse (analytics-purpose integrated DB)
  |                            |
  |                            |
+--------- inventory sync ---+| Integration method | Characteristics |
|---|---|
| API (REST / GraphQL) | Real-time, loosely coupled |
| Event-driven (Kafka etc.) | Async, fault-tolerant |
| File integration (CSV etc.) | Batch, legacy |
| DB share | Tightly coupled, should avoid |
DB sharing is now a bad move - a pattern to migrate to API / event-based.
Lifecycle management and TIME evaluation
Apps have lifespans. Need to plan updates and retirements aware of the lifecycle of introduction → growth → maturity → decline → retirement. Without this, legacy accumulates.
| Phase | Management point |
|---|---|
| Introduction | PoC, Go/No-Go decision |
| Growth | Adoption expansion, SLA strengthening |
| Maturity | Operational optimization |
| Decline | Successor consideration |
| Retirement | Data migration, service end |
Retirement is an extremely difficult task to execute - even what “shouldn’t be in use” is sometimes used in the field and can’t be stopped. Planned Sunset operations are important.
TIME evaluation is how each application gets a verdict.
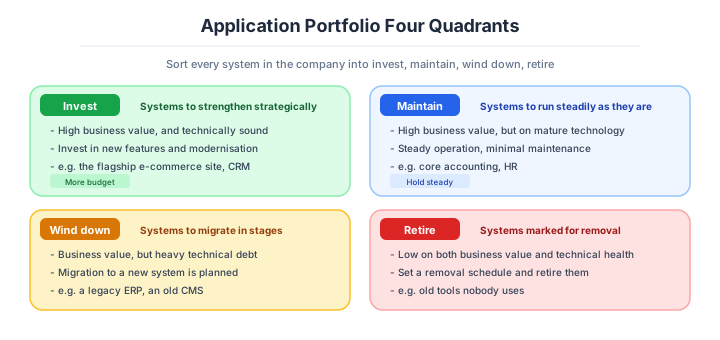
Gartner’s TIME model is the framework evaluating each app in 4 quadrants. Classifying apps on the 2 axes of “tech value” and “business value” - used for investment decisions.
| Evaluation | Business value | Tech value | Action |
|---|---|---|---|
| Tolerate | High | Low | Maintain status quo |
| Invest | High | High | Continued investment |
| Migrate | Low | High | Migrate to new platform |
| Eliminate | Low | Low | Retire |
Gartner’s TIME is a powerful tool rationalizing the decision to stop, used to organize legacy systems.
SaaS-first and integration patterns
Modern AA is designed via combination of SaaS and in-house. The basic strategy is “in-house for differentiation areas, SaaS for common areas,” lowering in-house ratio to concentrate dev resources on differentiation.
| Area | Recommended |
|---|---|
| Core accounting / ERP | SaaS (SAP, Oracle, freee, etc.) |
| CRM / SFA | SaaS (Salesforce, HubSpot) |
| HR / labor | SaaS (Workday, SmartHR) |
| Differentiation services | In-house |
| AI / data analytics | SaaS foundation + in-house logic |
In practice, the realistic combination is “SaaS + in-house extension.” For example, customer management deploys Salesforce reusing core features, while industry-specific deal processes (regulated workflows for doctor visits in pharma, multi-stage approvals from quote to spec confirmation in manufacturing) are implemented as custom logic via Apex or external integration. Similarly, leave general accounting to freee / SAP, while implementing in-house pricing-design algorithms that become company strengths (demand-prediction-based dynamic pricing, customer-segment-optimized models, etc.) and connect to SaaS via API. Neither all in-house nor SaaS-only, the implementation pattern that balances differentiation and efficiency is placing company-specific logic on top of SaaS-prepared extension points (API, custom objects, Webhooks).
The modern is discarding the “must in-house” thinking - SaaS first has become standard.
The integration patterns available divide as follows.
There are multiple patterns for system integration. Choose by use case, frequency, and real-time demand.
| Pattern | Characteristics |
|---|---|
| Point-to-Point | Direct integration, simple |
| Hub & Spoke | Via central hub |
| ESB (Enterprise Service Bus) | Integration foundation, classic |
| iPaaS (Integration PaaS) | Modern answer for SaaS integration |
| Event-driven | Loosely coupled, scalable |
| Data Integration | Batch integration |
iPaaS (MuleSoft, Dell Boomi, Workato, Zapier) is the modern mainstream, realizing SaaS integration via low-code.
Cloud strategy sits on top of all of it.
AA is closely linked to cloud strategy. Need to have an overall plan for which systems to move to cloud and when. The 6R framework is the standard judgment criterion.
| 6R | Content |
|---|---|
| Retain (status quo) | Don’t move to cloud |
| Retire | Discard if not in use |
| Rehost (lift) | Migrate as is |
| Replatform (adjust) | Migrate with small changes |
| Refactor | Cloud-native-ize |
| Repurchase | Replace with SaaS |
How heavy the AA work should be depends on two things — first, the number of systems.
AA-setup cost is decided by system count. Tens is enough with Excel, hundreds+ requires dedicated tools.
| System count | Recommended |
|---|---|
| ~30 | Excel / spreadsheets |
| 30-100 | Notion / Confluence + diagrams |
| 100-500 | LeanIX / Ardoq |
| 500+ | Enterprise EA tools |
Second, how much transformation is actually needed.
Companies executing DX, cloud migration, M&A have AA decide transformation success. For steady-operation companies, minimum is enough.
| Transformation | Recommended |
|---|---|
| Steady operation | Annual inventory enough |
| In DX | AS-IS / TO-BE detailing |
| M&A | Both companies’ AA integrated analysis required |
| Cloud migration | 6R analysis pre-implementation |
Numeric gates for AA portfolio management
Note: Industry baseline values as of April 2026. Will become outdated as technology and the talent market shift, so requires periodic updates.
AA practice inventories all systems and tracks numerically. Below are industry-standard management metrics.
| Metric | Recommended | What to do if exceeded |
|---|---|---|
| Owner-unknown system rate | 0% (all owners identified) | Urgently inventory |
| Function-redundancy rate | 5% or less | Plan integration |
| Last deploy over 5 years | Inventory target | Eliminate candidate by TIME |
| Annual retired-system count | 5-10% of total | Operate Sunset plan |
| New-system introduction PRR rate | 100% | Production introduction forbidden if unimplemented |
| Shadow IT detection (annual) | 10% or less of all systems | Continuously monitor with CASB |
| Average system lifespan | 7-10 years | Reflect in update plan |
| API rate (of all systems) | 70%+ | From DB-sharing to API |
| SaaS / in-house ratio | 70% SaaS in common areas | SaaS-first principle |
TIME evaluation (Tolerate / Invest / Migrate / Eliminate) is standardly conducted annually. Frequent cases like “large-enterprise inventory finds 52 owner-unknown / 30+ deploy-7-years-ago” - tedious inventory is the foundation of AA operations.
AA: “orgs without maps are lost.” Without numerical management, redundant investment accumulates.
By case, the emphasis lands like this.
A startup, SaaS-centric, up to about thirty systems. 1 spreadsheet + Zapier / Make for SaaS integration. TIME analysis unneeded, check redundancy with existing only when introducing new SaaS. iPaaS introduction after monthly hundreds of integrations occur.
A mid-size enterprise with DX under way, 100 to 300 systems. LeanIX or Ardoq + function-map creation + annual TIME inventory. Maintain with 1-2 EA staff, hub via iPaaS like MuleSoft / Workato, operate Sunset plan retiring 10 Eliminate-target systems yearly.
A large enterprise with a lot of legacy, 500 systems and up. Enterprise EA tools (Mega / BiZZdesign) + dedicated EA team + 6R analysis. Dedicate Application Portfolio Management (APM), link with cloud-migration plan. Phase-replace DB-sharing integration with API / event-driven.
An M&A or business integration in progress. Both companies’ AA matching + redundant-system consolidation roadmap + master alignment. Decide systems to keep via TIME evaluation, transition-period connection via iPaaS, parallel master integration linked with data architecture’s MDM.
AI decision axes — Evolving into “a set of systems the AI can use”
When AI-driven development (vibe coding) and AI usage are the premise, AA is redefined as system groups that AI can build and tear down. AI-driven development enables rapid creation of wrappers and integrations for existing systems, dramatically lowering “system-integration cost.”
The era when AI agents themselves become users of corporate systems is approaching, and systems that aren’t API-ized get left behind in the AI era. Whether AI can use the system becomes the new evaluation axis.
AI-era AA is valued by whether it’s connected via API. Extend legacy with wrappers.
Systems without APIs are left behind in the AI era
For an AI agent to “use” a system, an API must exist. Legacy systems accessible only via screen operations are unreachable by AI agents. RPA-based UI automation is an option but is fragile and expensive to maintain.
API-ifying legacy systems (via the Strangler pattern for staged migration) should be prioritized as the minimum infrastructure investment for AI utilization.
AI agents autonomously executing cross-system integration
When company-wide systems are unified on API + OIDC authentication, AI agents can autonomously run cross-cutting processes like “fetch from customer management -> check inventory system -> place order in order system.” Designing this configuration at the EA level determines the competitive edge of enterprise systems in the AI era.
“Whether it’s AI-usable AA” decides value. Rebuild via SaaS-first + API loose coupling.
Pitfalls and forbidden moves
Here are the six most dangerous of the typical ways AA goes wrong. Every one of them has the structure of waste accumulating without anyone noticing.
| Forbidden move | Why it is bad → what to do instead |
|---|---|
| Never taking inventory, so nobody knows what exists | the reality of 52 systems with no known owner → build the portfolio first |
| Continuing to integrate systems by sharing a database | the tight coupling makes change impossible → replace it in stages with APIs and event-driven integration |
| Being unable to let go of the build-everything-in-house myth | development resource melts into areas a SaaS would cover → build in-house only where you differentiate |
| Running TIME evaluation but never actually eliminating the Eliminate candidates | licence and maintenance fees pile up into the hundreds of millions of yen → put five to ten percent of retirements a year into a sunset plan |
| Installing an EA tool such as LeanIX and then leaving it alone | with no regime to maintain the data it goes stale within a year → pair it with an operation for collecting and updating |
| Integrating systems after an M&A without reconciling both companies’ AA | duplication and contradiction turn it into a multi-year integration project → decide which systems survive with TIME evaluation first |
The belief that “more systems means a stronger business” is backwards as well. Too many and they cannot be integrated at all, which lowers their value; consolidation and retirement are the skills that matter.
Author’s note - cases where “inventory revealed half were ghosts”
Seriously inventorying application portfolios for the first time, many large enterprises shock at the dire state of their legacy assets.
When an IT department of a large enterprise inventoried company-wide systems, the situation surfaced where, of 487 systems declared running, 52 were owner-unknown, over 30 had last deploys 7 years ago - widely told in industry. Furthermore, departments A and B had ordered systems with completely the same features from different SIers, with different vendors stationed on adjacent floors - non-laughing real cases also frequently reported. After it later became known that hundreds of millions of yen yearly disappeared in licensing and maintenance fees alone, management calling it a problem of “who was watching our IT assets” - a typical development.
Another, the 2017 British Airways large-scale outage continues to be cited as a case showing the danger of tightly-coupled legacy. In May 2017, BA’s check-in system triggered chain-stopping of all systems from power-restoration mistakes, with 3 days worldwide, about 75,000 passengers affected, estimated damage exceeding GBP 100M. Digging the cause revealed that 20-year-old tightly-coupled legacy chains failed in dependency at power restoration. Still referenced today as a symbolic case showing “the cost of operating without visualizing AA.”
Both slap home that “orgs without maps” continue to be hit unannounced - whether by redundant investment or chain failures.
What to decide - what is your project’s answer?
For each of the following, try to articulate your project’s answer in 1-2 sentences. Starting work with these vague always invites later questions like “why did we decide this again?”
- Application catalog (inventory all systems)
- Function map (linking with capabilities)
- Interface map (visualize integration)
- Lifecycle evaluation (TIME classification)
- Integration patterns (iPaaS adoption etc.)
- Cloud strategy (6R analysis)
- EA tools (LeanIX / Ardoq etc.)
When it comes to the final call, the order is this.
The core of EA-perspective AA is the thinking of making a map of what’s in your company. Large enterprises hold hundreds to thousands of systems, with redundancies, gaps, and shadow IT generating hundreds of millions yearly in waste. The work of EA-perspective AA is setting up application portfolios, visualizing capability links via function maps, and rationalizing “the decision to stop” via TIME model. The modern rule is discarding in-house myth, SaaS-first with only differentiation areas in-house, integrating via iPaaS / API. DB-sharing integration is a bad move - replacing with API / event-driven became standard.
Another decisive axis is evolution to a system group AI agents can use. AI-driven dev dramatically lowers system-integration cost, and AI agents themselves become new users of corporate systems. API-ized, OAuth/OIDC-standard, metadata-rich system groups are extended by AI; tightly-coupled legacy and custom protocols get left behind. “Whether AI can use it” is the new evaluation axis.
Related Articles
Summary
This article covered EA-perspective Application Architecture, including portfolio, function map, TIME, SaaS-first, iPaaS, 6R strategy, and AI-era API loose coupling.
Tool selection per scale, SaaS-first focus on differentiation, planned Sunset via TIME, lean toward API-centric loose coupling. That is the practical answer for EA-perspective AA in 2026.
Next time we’ll cover Technology Architecture (TA) (cloud standards, tech reference).
Back to series TOC -> ‘Architecture Crash Course for the Generative-AI Era’: How to Read This Book
I hope you’ll read the next article as well.
Also popular with readers
📚 Series: Architecture Crash Course for the Generative-AI Era (78/95)