
Proverbs on Seasonal and Monthly Market Anomalies
The stock market is home to countless proverbs that have provided investors with important lessons over the generations. These sayings are grounded in the real-world experience of those who came before us — knowing them can help you navigate even the most turbulent markets with an edge.
This article introduces stock market proverbs and anomalies related to monthly and seasonal patterns, and briefly explains the meaning of each.
- January Effect (late December – early January)
- Setsubun Peak (early February)
- Spring Equinox Bottom (mid-March)
- April Rally / Koinobori Peak (early April – early May)
- Sell in May (late April – early May)
- Summer Doldrums (early July – end of August)
- Autumn Equinox Bottom (late September)
- Halloween Effect (end of October)
- Late November High (late November)
- Tax-Loss Selling (early to mid-December)
- Year-End Rally (last week of December)
What Is an Anomaly?
Before explaining each anomaly, a quick definition for those unfamiliar.
In investing, an anomaly is “a regularity observed through experience by many people, though it cannot be theoretically explained with certainty.”
These are just empirical patterns — they don’t occur with certainty. But they happen frequently enough to be significant, and many investors try to profit by incorporating them.
Of course, there’s always a chance any given anomaly won’t materialize, so treat them as reference points for your own judgment — not guarantees.
A visual overview of the major anomalies throughout the year:
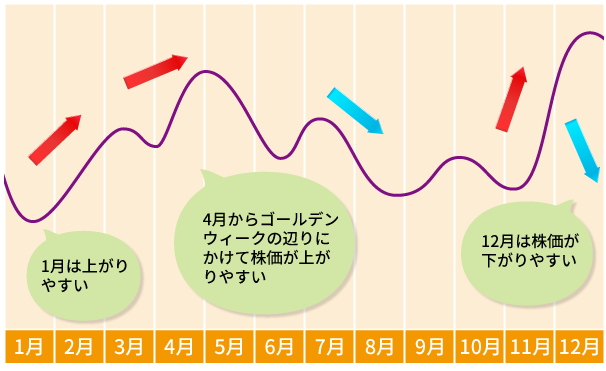
Anomaly image sourced from:
Anomalies - Stock & Securities Glossary | Okasan Online Securities (okasan-online.co.jp)
From this image, the general seasonal pattern becomes clear: good times to buy cheaply tend to be around February, August, September, October, and November; good times to sell high tend to be around April, May, and December.
Investors who trade around anomalies often follow a cycle of buying in October–November and selling around the start of May. This strategy works better for index and large-cap investing than for individual stocks, which are heavily driven by their own news.
January Effect (Early January)
This anomaly holds that stock prices tend to rise from late December through early January. Late December also has a separate anomaly (“Year-End Rally”), but the reason behind both is broadly the same.
From early to mid-December, hedge funds and large institutional investors tend to make many sell orders to lock in gains or losses for tax purposes. But by the final week of December, those players have settled their positions and start buying again — pushing prices up through early January.
Setsubun Peak (Early February)
If the January Effect produces a price rally, that rally tends to continue through approximately Setsubun (the traditional end of winter, around February 3–4). This is called the “Setsubun Peak” anomaly.
After Setsubun, prices tend to start declining toward the “Spring Equinox Bottom.” One strategy: sell at Setsubun and buy back about a month later.
Spring Equinox Bottom (Mid-March)
After the Setsubun Peak, markets tend to adjust through the end of Japan’s fiscal year (March 31), with a declining trend continuing from early February through mid-March (the spring equinox, higan). This is the “Spring Equinox Bottom” (春の彼岸底).
There are two “equinox bottoms” per year — spring and autumn — so this article distinguishes them separately.
That said, this particular anomaly has relatively low reliability — the downtrend from February to March doesn’t always materialize. Since it seems tied to March fiscal year-end adjustments and depends heavily on each company’s individual earnings expectations and the broader economic environment, it may not warrant much attention compared to other anomalies.
April Rally / Koinobori Peak (Early April – Early May)
Primarily a Japanese stock anomaly. Stocks tend to start rising in early April and peak around May 5 (Children’s Day / Tango no Sekku) — hence the name “Koinobori Peak” (after the carp-shaped streamers flown on that holiday).
The reason: April is the start of Japan’s fiscal year, and various institutional investors deploy new-year capital, bringing fresh funds into the market. U.S. tax filing season overlapping with this period also brings in U.S. investor capital.
Sell in May (Late April – Early May)
One of the most famous stock market anomalies: “Sell in May.” It advises getting out of all positions by early to mid-May, since stocks tend to peak around late April–early May and then enter a declining trend (partly due to the summer doldrums that follow).
Historical data does show a high frequency of the Nikkei Average peaking in late April–early May, followed by a lull through roughly November. Among all seasonal anomalies, this one has relatively high reliability.
The original proverb is British: “Sell in May, and go away, don’t come back until St Leger Day.” The St Leger Stakes is a September horse race in England. The original meaning was “buy in September, sell in May” — reflecting when England’s markets historically bottomed.
For Japan, the equivalent would be “buy in October–November, sell in May” — and many investors do follow roughly that cycle.
Summer Doldrums (Early July – End of August)
The second most famous anomaly after “Sell in May.” Stock markets tend to go quiet in July–August as trading volume falls and prices drift lower.
The reason: just as summer vacation season in Japan means fewer active traders, the same is true globally — investors are on holiday, market participants thin out, and activity slows.
“Sell in May” is partly warning about this coming slowdown. Conversely, the summer dip can also be seen as a good time to quietly accumulate positions.
Late August in particular often sees some recovery as investors start thinking about building positions for the autumn.
Note: this anomaly was historically very pronounced, but the spread of internet trading has reduced its strength in recent years.
Autumn Equinox Bottom (Late September)
Following the summer doldrums, September–October markets tend to stay in a downtrend. The autumn equinox (late September) is seen as the approximate bottom of this trend — hence “Autumn Equinox Bottom.”
This is the second of the two “equinox bottoms” per year. The downtrend running from May through autumn typically finds its approximate floor around this time, and with the “Halloween Effect” to follow in October, October–November is widely seen as the prime buying season.
Halloween Effect (End of October)
This anomaly holds that the stock market tends to shift into an uptrend around Halloween (October 31).
The autumn equinox bottom marks the approximate floor of the post-May downtrend, and after some consolidation, October 31 is seen as the turning point into a new uptrend.
This makes late October a well-known buying window, with many investors saying: “If there’s a stock you want, buy it in late October to early November.”
The precise reason for the Halloween turning point isn’t fully understood, but some attribute it to European hedge funds’ fiscal year-ends clustering in November.
Late November High (Late November)
Following the Halloween Effect and its uptrend, the “Late November High” anomaly suggests that the market tends to form a temporary top in the final week of November.
This is because “tax-loss selling” — described next — begins in early-to-mid December, creating downward pressure in December’s first half. As a result, late November tends to be a local high.
One strategy: buy in late October (Halloween Effect), sell in late November, and buy back in mid-December.
Tax-Loss Selling (Early to Mid-December)
December brings year-end tax considerations. Large investors need to realize losses on losing positions to offset gains and reduce their tax bill, creating a wave of selling in early-to-mid December. This is “tax-loss selling.”
Here’s the logic: Japanese investment income taxes are based on annual net gains — roughly 20%. Unrealized gains and losses on positions still held don’t count. By selling a losing position before year-end, you lock in the loss and reduce your taxable income.
And you can immediately rebuy the stock — your position stays the same, but you’ve lowered your tax bill for the year. For investors with significant gains, this is a standard year-end technique.
For holdings with unrealized gains, the year in which you sell determines which year’s tax bill it hits — so some investors also sell winners before year-end for planning purposes, adding to December’s selling pressure.
Because tax-loss selling reliably creates selling pressure in early-to-mid December, a December downtrend is one of the higher-reliability seasonal anomalies.
Year-End Rally (Last Week of December)
The “Year-End Rally” (掉尾の一振, tōbi no isshin) means that stock prices tend to rise strongly in the final week of the year.
As large institutional investors who were doing tax-loss selling re-establish their positions, the final week of December through the first week of January tends to see a strong rally. This is what the proverb describes.
“掉尾” means “gaining momentum at the very end of something,” and “一振” means “one powerful swing” — together, “one powerful swing of momentum at year’s end.”
There is an element of investor hope — wanting the year to end on a high note — but this anomaly has a relatively high rate of occurrence and is considered one of the more reliable seasonal patterns.
Summary
This article introduced stock market proverbs and anomalies related to monthly and seasonal patterns. Knowing these in advance will help you navigate even the most turbulent markets — keep them in mind whenever you execute a trade.
I also have an article on investment fundamentals. Check it out if you’d like to strengthen the basics.

📚 Series: Stock Market Proverbs Series (8/9)


