About This Article
This article explains the key indicators used to measure overall market overheating in the investment world — what they mean and what levels are considered dangerous.
Most investors track the Nikkei Average or S&P500 to get a rough sense of how overheated a given market is.
That’s not wrong, but it’s extremely difficult to judge whether the market is truly overheated from index charts alone.
Fortunately, there are dedicated indicators specifically designed to assess whether the overall market is overheated or not. This article covers three of the most widely used ones.
Indicator Summary
The three indicators covered in this article are:
- Buffett Indicator (Buffett Indicator)
- VIX Index (Volatility Index / Fear Index)
- AAII Investor Sentiment Survey (The AAII Investor Sentiment Survey)
All three are commonly used in the investment world to gauge market overheating. Specific benchmark levels are summarized in the table below.
[table id=4 /]
Buffett Indicator
The Buffett Indicator measures stock market valuation by dividing the total market capitalization of all listed stocks by the country’s GDP.
Most investors look at the Nikkei or S&P500 chart and judge “high / fair / low” from the chart shape. But stock prices are fundamentally linked to the real economy — as the economy grows, companies expand and stock prices rise (in theory). The Buffett Indicator compares the stock market level to actual economic output (GDP) to assess whether valuations are reasonable.
Warren Buffett mentioned this indicator in a 2001 Fortune magazine interview, calling it “probably the best single measure of where valuations stand at any given moment.” The name followed.
Formula:
Buffett Indicator = Total Stock Market Capitalization ÷ GDP
Benchmarks:
- Below 99%: Market is undervalued
- 100%–120%: Market is fairly valued
- 121%+: Market is overvalued
Historical cases where the Buffett Indicator proved its worth:
- 2000 Dot-com Bubble: The indicator surged well above 100%, signaling overheating. The bubble subsequently burst and markets crashed.
- 2008 Pre-Lehman: The indicator again reached high levels, warning of overheating. The financial crisis followed.
- Post-2020 COVID Recovery: As stocks surged during economic recovery, the indicator once again hit elevated levels.
Why Buffett values this indicator:
- Simplicity: Very easy to calculate and interpret.
- Big-picture view: Evaluates the entire market relative to the whole economy, not individual sectors.
- Historical track record: Has consistently issued valid warnings ahead of major crashes.
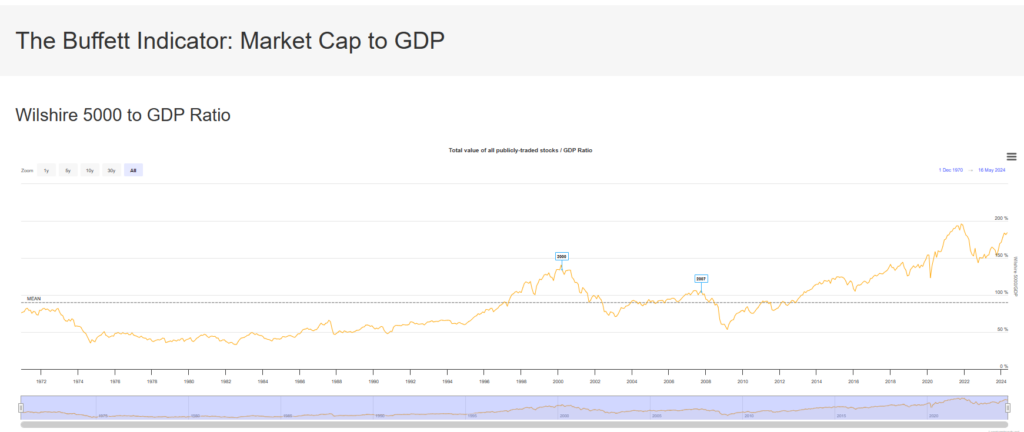
U.S. stock market vs. GDP (Buffett Indicator) sourced from:
The Buffett Indicator: Market Cap to GDP - Updated Chart | Longtermtrends
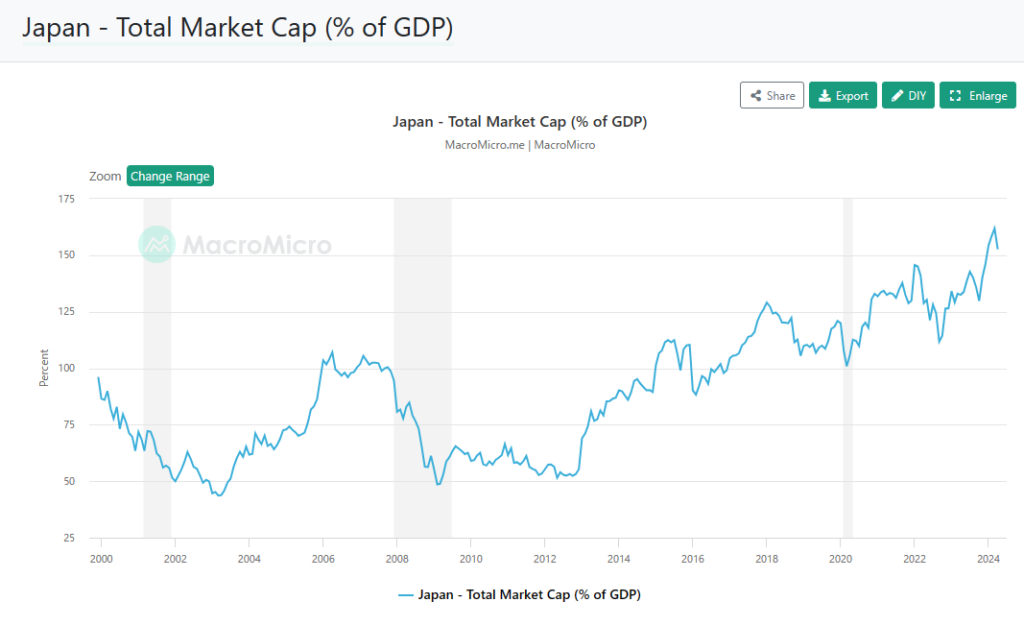
Japan stock market vs. GDP (Buffett Indicator) sourced from:
As of April 2024, both the U.S. and Japan Buffett Indicators are well above 150%, suggesting both markets are significantly overvalued relative to their real economies.
That said, the Buffett Indicator is just one reference point. A high reading doesn’t automatically mean a crash is imminent — many factors influence stock prices, and you need to consider other indicators alongside it.
VIX Index (Volatility Index / Fear Index)
The VIX Index (Volatility Index), also known as the Fear Index, is a measure of market volatility provided by the Chicago Board Options Exchange (CBOE). It estimates the expected 30-day volatility of the U.S. stock market by aggregating weighted prices of a broad range of S&P500 call and put options.
“Volatility” refers to the degree of price fluctuation. High volatility means prices are swinging widely (cryptocurrency, for example, has much higher volatility than stocks).
The VIX was developed by CBOE in 1993, originally based on S&P100 (OEX) options. In 2003 it was updated to use S&P500 options, which remains the current methodology.
How the VIX Is Calculated
The exact formula is highly complex — as shown below.
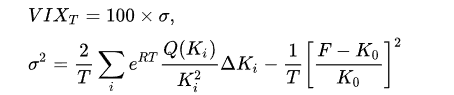
You don’t need to understand this formula in detail. Simply remember: the VIX measures the volatility level of the U.S. stock market. When it’s high, markets are highly unstable.
Benchmarks:
- Below 20: Market is relatively stable
- 20–30: Market is becoming somewhat unstable
- 30–40: Market is quite unstable
- 40+: Market is extremely unstable
Historical examples:
- 2008 Lehman Shock: VIX hit an all-time high above 80 — extreme market fear.
- 2020 COVID Shock: VIX again exceeded 80 as pandemic uncertainty peaked.
A common principle: extremely high VIX often signals a market bottom; extremely low VIX often signals a market top. Excessive fear or excessive optimism can serve as contrarian signals.
Investors and traders use VIX for risk management: reducing positions or adding hedges when VIX is high.
Note: VIX measures short-term volatility and is not designed for long-term market prediction. It also reflects only the U.S. market and may not fully capture global trends.
AAII Investor Sentiment Survey
The AAII Investor Sentiment Survey is a weekly survey measuring individual investor sentiment. Unlike the other two indicators, it’s not derived from complex calculations — it simply asks investors how they feel about the market.
That simplicity is actually what makes it so readable. It clearly reflects how current market participants feel about the situation.
Each week, AAII members are asked how they expect the stock market to perform over the next 6 months: Bullish, Bearish, or Neutral.
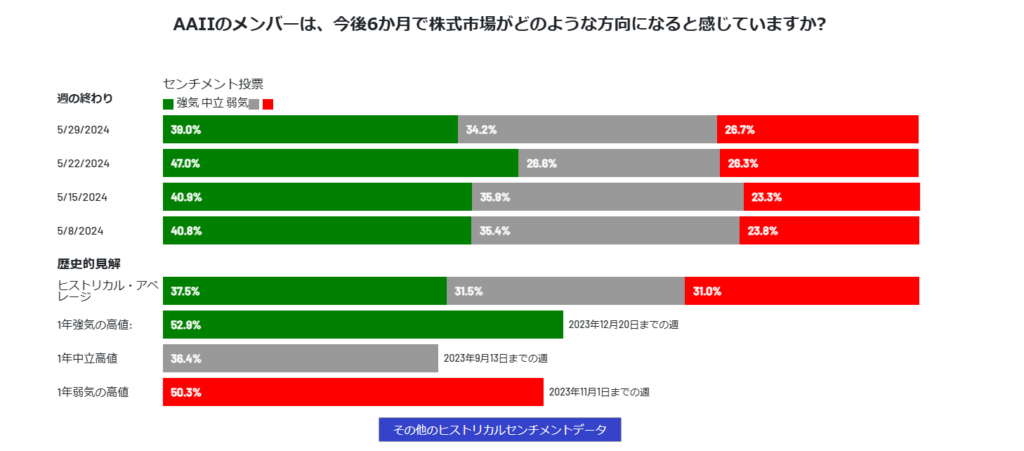
The image above shows a recent survey result from the official site. Here are general interpretation guidelines:
Bullish Percentage
- Below 40%: Low optimism. Market is calm or bearish sentiment dominates.
- 40%–50%: Normal range. Moderate optimism; market is stable.
- 50%+: High optimism; market may be overheating. Historically, sustained high bullish readings often precede corrections.
Neutral Percentage
- Below 20%: Investors have a clear directional opinion — either strongly bullish or bearish.
- 20%–40%: Normal range. Investors are balanced and uncertain.
- 40%+: Investors are uncertain and cautious. Suggests market ambiguity.
Bearish Percentage
- Below 20%: Investors are very optimistic. Market may be overheating; correction risk is elevated.
- 20%–30%: Normal range. Some wariness among a portion of investors.
- 30%+: Investors are very pessimistic. High bearish readings often precede market bottoms.
Historical applications:
- 2008 Lehman Shock: Bearish readings surged, reflecting widespread pessimism. The high bearish reading preceded a market bottom.
- 2020 COVID Shock: Bearish spiked early in the pandemic, then bullish recovered alongside the market recovery.
The AAII survey is particularly useful for contrarian investors — very high bullish readings may suggest a market peak; very high bearish readings may signal a bottom.
Summary
This article covered three indicators used to measure overall market overheating.
As an active investor, it’s easy to focus only on your specific holdings and lose perspective on the broader market. Checking these indicators regularly helps you maintain an objective view.
If the market appears genuinely overheated across multiple indicators, consider exiting ahead of others — in the investment world, that kind of disciplined judgment is what allows you to survive long-term.
For those focused on value investing, combining these broad market indicators with the fundamentals-based indicators in the article below will enable an even more disciplined investment approach.