
Thank you for visiting the site. This article is about the “limits” of building a project schedule in Excel.
Plenty of teams still run their schedules in Excel, and I have spent years living with Excel Gantt charts on software projects myself. I do not think Excel is a bad tool at all. But once a project passes a certain size, the trouble that the Excel schedule itself causes follows a fairly predictable pattern.
Here I have sorted the problems that actually show up into four, then covered what to do if you have to stay on Excel anyway, and how to think about picking a replacement. At the end I introduce the free scheduling tool I built.
Why Excel Schedules Keep Winning Anyway
Before talking about limits, it is worth being fair about Excel’s strengths. Dismissing it as “outdated” without acknowledging these gets you nowhere with an actual team.
- Everybody already has it. No procurement, no training
- It is completely free-form. Add a column, colour a cell, drop in a notes field, all on the spot
- No extra cost (within your existing Office licence, strictly speaking)
- You can print it for a meeting, or send the file straight to a client
In other words, an Excel schedule is “the schedule with the lowest possible start-up cost”. That is exactly why every project begins there. The problems appear later, once the project has grown and the schedule has grown with it.
Problem 1: You Cannot See the Slippage
I actually think this is the biggest problem, which surprises people. You draw the bars and fill in how far each one has got. It looks like progress is visible, but in most cases what is missing is whether you are behind the plan.
Say a task sits at 50%. Whether that is fine or alarming cannot be judged without comparing it to “what percentage it should be at today”. Doing that in Excel means building an expected-progress column, layering on conditional formatting, and generally accumulating homemade machinery.
The classic answer to this problem is the “slip chart line” — a zig-zag line drawn from a status date through each task’s actual progress position. Tasks that are behind bend the line to the left; tasks running ahead push it out to the right. It is an excellent technique for sharing the state of a project at a glance in a status meeting, but drawing it by hand every week in Excel is a real chore. I have covered slip chart lines in detail in a separate article.

Problem 2: Every Plan Change Means Manual Work
Project plans always change. And the Excel schedule is the thing that copes worst with change.
- A predecessor slips three days, so you shift every downstream date by hand
- A task crosses a weekend or a holiday, so you redo the working-day arithmetic in your head
- Adding or deleting a row breaks the merged cells, so you start by repairing the layout
Dependencies are the painful part. Excel has no idea about the completely ordinary constraint that “implementation cannot start until design is finished”. So every time one thing slips, a human has to trace the blast radius by eye and fix it. That work gets more frequent as a project moves into its later stages, which is precisely when nobody has time for it.
You can automate it with formulas, but a schedule built on WORKDAY and layers of conditional formatting tends to become a “secret sauce” that only its author can maintain. Honestly, there is nothing scarier than an Excel schedule whose author has moved to another team.
Problem 3: “Is Somebody in That File?”
Running a shared-folder Excel file with several people has a familiar set of problems.
- Someone has it open, so you cannot edit (you open read-only, and your changes vanish)
- The
schedule_final_v2_revised_(2).xlsxproblem. Nobody knows which one is real - Somebody, usually the most junior person, ends up going around collecting progress and typing it in
Microsoft 365 co-authoring softens this to a degree, but then you get a different accident: “one person re-sorts, and everybody’s screen shifts at once”. A spreadsheet is ultimately a free-form grid of cells, so nothing is guarding the schedule’s internal consistency on your behalf.
Problem 4: You Cannot See Who Is Overloaded
Everything is on the schedule, and yet “who is busy, and when” is invisible. That is the other weakness.
A table of tasks and a table of per-person load stacked along a date axis (a “resource load chart”) need completely different aggregations. Building the load chart in Excel drops you into pivot tables and SUMIFS, and now you are maintaining two things that have to agree. The result is that work quietly piled onto one person — something you could have caught at planning time — only surfaces once the project is on fire.
How to build and read a load chart is covered in this article.
If You Are Staying on Excel
That said, plenty of teams cannot leave Excel: the client mandates the format, or an audit requires an Excel deliverable. In that case, deciding these three things up front makes a substantial difference.
| Practice | What it means |
|---|---|
| One person updates the file | Collect progress reports over chat; only one person touches the schedule |
| Ban merged cells | The single biggest cause of breakage on row insert or delete. Use colour and indentation instead |
| Separate “plan” from “actual” | Keep the original planned columns; put changes only in the actual columns, so the gap stays visible |
To put it plainly, this is the work of “running Excel as if it were a scheduling tool”. And if you are going to lock the process down that far, a purpose-built tool is well worth a look.
How to Choose a Replacement
There are plenty of scheduling tools out there — Backlog, Asana, Jira, Microsoft Project and so on. The axis to choose on is not the length of the feature list but whether it fits your team’s actual circumstances.
| Type | Suits teams that | Watch out for |
|---|---|---|
| Cloud (Backlog, Asana, …) | Want simultaneous editing and notifications | Monthly cost. Some organisations need approval to put data on an outside service |
| Heavyweight (MS Project, …) | Are large, with real dependency and resource management | Steep learning curve, and expensive licences |
| Local (INAZMA, below) | Want to start alone, or cannot let data leave the device | No real-time collaborative editing |
The point people overlook most is whether the data is allowed to sit on an external service at all. A schedule containing client names and staff names is genuine confidential information, so it is not unusual for a cloud-tool request to be refused and the team to end up back in Excel.
I Ended Up Building My Own
My own answer to this was “build a scheduling tool that needs no sign-up and runs entirely in the browser”. That tool is INAZMA, and it is free.
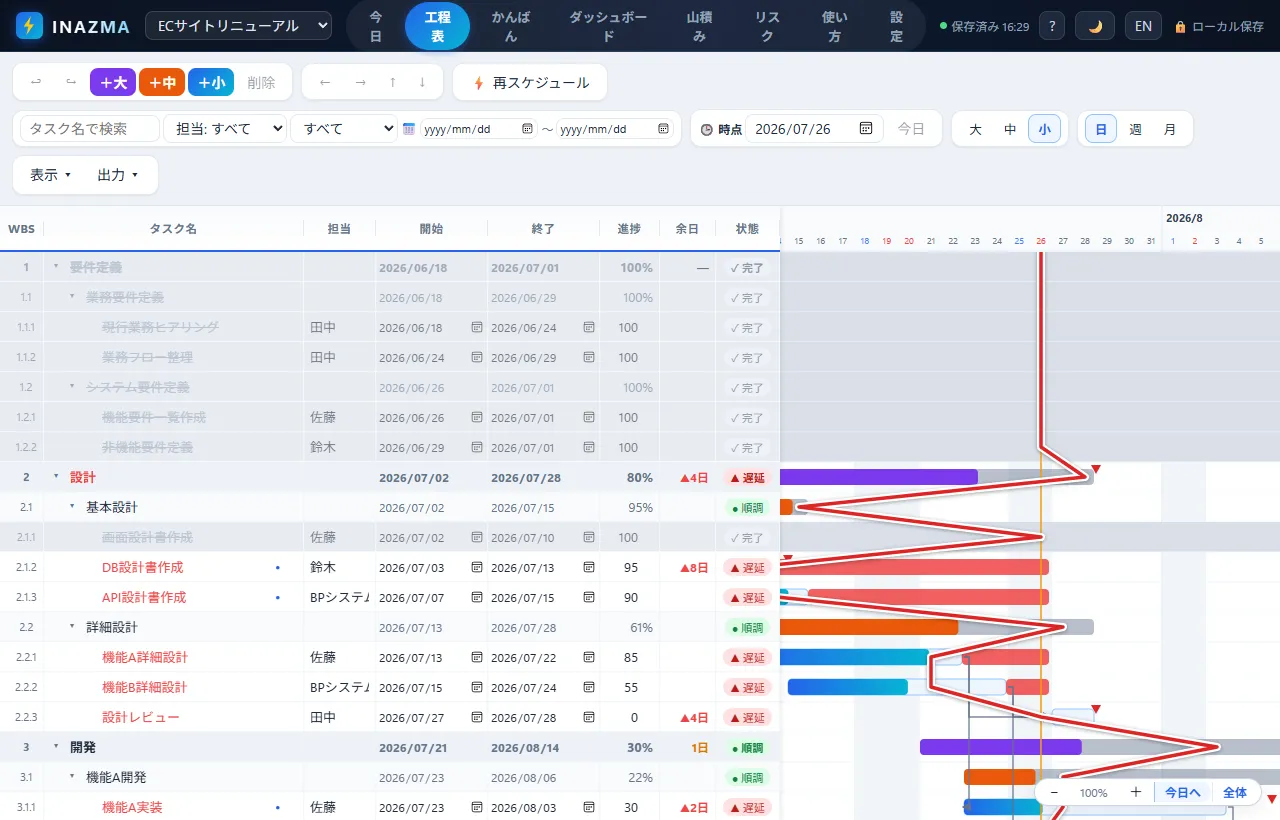
Against the four Excel problems above, it answers like this.
- Slip chart lines are drawn automatically. Daily progress is recorded on its own, and you can replay past lines
- Enter your dependencies and one click reschedules the downstream tasks around a slipped predecessor
- Data is stored only inside your browser and never sent to any server, so there is no approval process to worry about
- The resource load chart is built in, aggregating load per person per working day against a capacity line
Moving off Excel was a design goal too: “copy a cell range in Excel and paste it into the schedule with Ctrl+V” is enough to import your tasks. Dates, owners and progress columns are detected from their contents, so trying it with your current schedule takes a couple of minutes. It also prints to A3 landscape, so a paper-based meeting culture is no obstacle.
There are of course “features it deliberately does not have”, real-time collaborative editing being the main one. If that is essential for your team, a cloud tool is the right call. It is free, so dropping one of your own projects into it is enough to see whether it fits.
⚡ Try INAZMA (free)No sign-up, runs in the browser. Your data stays on your device
Summary
This article covered where Excel schedules run out of road.
The problems boil down to four: slippage you cannot see, poor tolerance for change, breakage under sharing, and invisible overload. None of them show up while the schedule is small, so by the time you notice, maintaining the schedule has quietly become a job in itself.
At the same time, Excel’s convenience and flexibility are real, and I do not think you have to throw all of it away. Either tighten up how the file is updated and stay, or move to something that fits your team. I hope this gives you something to decide with.
As companion pieces, I have also written up how to draw a slip chart line and how to build a resource load chart.
I hope you will read the next article as well.
Also popular with readers
📚 Series: Project Management in Practice (Beyond Excel, Slip Charts, Load Charts) (1/3)