Thank you for visiting this site. This article is the fourth installment in the series on code-manageable diagrams for the AI era, covering 3 domain-specific design tools. For the full series index, see the Complete Guide.
Mermaid and D2 were general-purpose tools for drawing any kind of diagram, but the three tools in this article are each specialized for a particular design domain. In return, they deliver expressive power and productivity in their respective areas that no general-purpose tool can match.
Why are these tools important in the AI era? The reason is clear: just conveying your design intent to an AI produces output usable directly in a specification document. Say “design the e-commerce DB in DBML” and you get table definitions plus relations in one go. Say “draw the microservice architecture on AWS using Diagrams” and a diagram with official icons is generated. This workflow — where design and diagram creation complete simultaneously — was simply unimaginable before AI.
Comparison Table
| Name | Syntax | AI Compatibility | Diagram Types | Highlights |
|---|---|---|---|---|
| Structurizr | Custom DSL | ◎ | System-wide architecture (4 zoom levels) | Auto-generates from high-level to detailed views from a single definition |
| DBML | Custom | ◎ | Database table relationship diagrams (ER diagrams) | Auto-generates ER diagrams; can also convert to SQL |
| Diagrams (Python) | Python | ◎ | Cloud architecture diagrams (AWS/GCP/Azure) | 500+ official cloud icons built in |
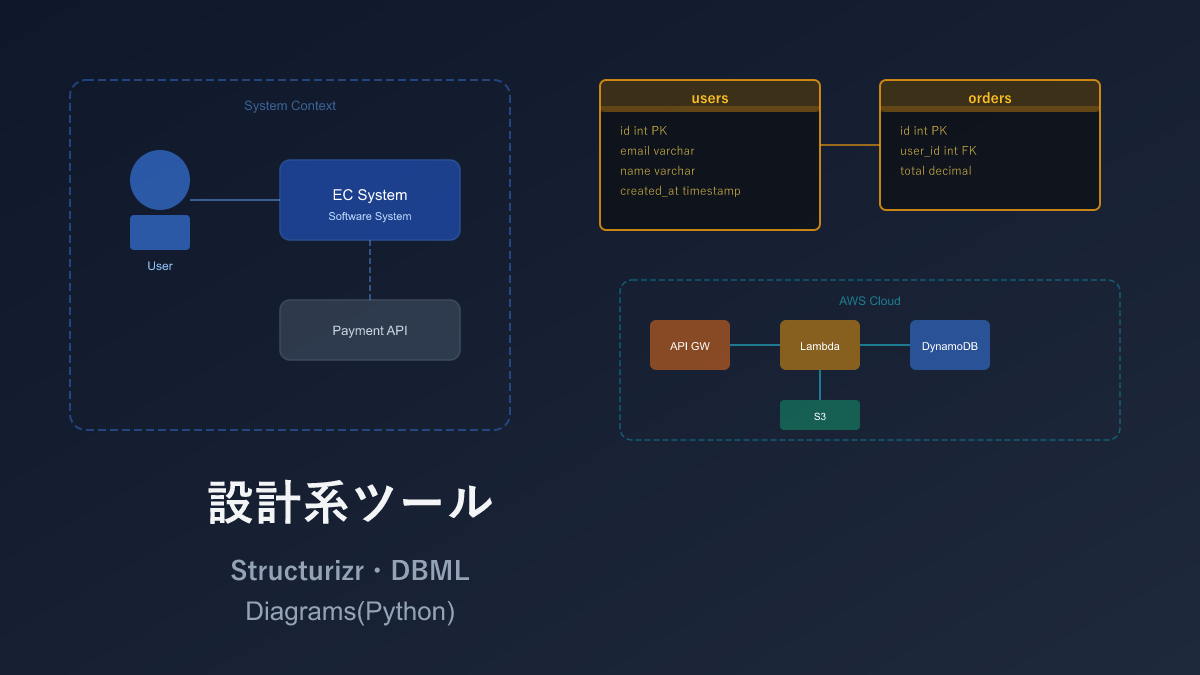
Structurizr DSL — Structured Architecture via C4 Model
Structurizr DSL is a tool for describing software architecture diagrams in code, based on the C4 Model proposed by Simon Brown.
The C4 Model organizes a system into 4 zoom levels (system context → containers → components → code). Structurizr can auto-generate all 4 levels of diagrams from a single definition file. Rather than “drawing diagrams one by one” like Mermaid or D2, the fundamentally different approach is: “define the system structure once and multiple diagrams appear automatically.”
Sample: E-Commerce Site Model Definition

workspace {
    model {
        user = person "User" "Regular user of the web application"
        admin = person "Admin" "Internal staff managing the system"

        softwareSystem = softwareSystem "E-Commerce Site" "Online shopping system" {
            webapp = container "Web Application" "React SPA" "TypeScript"
            api = container "API Server" "REST API" "Node.js"
            db = container "Database" "User, product, and order data" "PostgreSQL" "Database"
            cache = container "Cache" "Session and product cache" "Redis" "Database"
        }

        emailSystem = softwareSystem "Email System" "Send order confirmation emails" "External"
        paymentSystem = softwareSystem "Payment System" "Credit card payment processing" "External"

        user -> softwareSystem "Browse and purchase products"
        admin -> softwareSystem "Manage products and orders"
        softwareSystem -> emailSystem "Send emails"
        softwareSystem -> paymentSystem "Process payments"
    }

    views {
        systemContext softwareSystem "SystemContext" {
            include *
            autoLayout
        }
        container softwareSystem "Containers" {
            include *
            autoLayout
        }
    }
}
A single model definition generates both a Level 1 context diagram (overview) and a Level 2 container diagram (detail) simultaneously.
Sample: Deployment Diagram

    model {
        deploymentEnvironment "Production" {
            deploymentNode "AWS" {
                deploymentNode "ap-northeast-1" {
                    deploymentNode "ECS Cluster" {
                        containerInstance api
                    }
                    deploymentNode "RDS" {
                        containerInstance db
                    }
                }
                deploymentNode "CloudFront" {
                    containerInstance webapp
                }
            }
        }
    }
Physical deployment topology can be expressed in the same DSL.
Pros and Cons
The decisive difference from Mermaid is that you are “defining a model,” not “drawing a diagram.” Multiple abstraction levels of diagrams auto-generate from a single model definition — the executive overview and the developer detail view come from the same file. Eliminating the risk of information inconsistency between diagrams is genuinely valuable in large projects.
In return, the entry barrier is high. Understanding the C4 Model concepts (Context/Container/Component/Code) is a prerequisite alongside the DSL syntax, and diagrams that don’t fit the C4 framework — flowcharts, sequence diagrams — cannot be drawn. For a team of 5–10, Mermaid may well be sufficient.
Note: Structurizr has a cloud version (paid) and a Lite version (free, Docker-based).
AI Compatibility
The structured DSL syntax is relatively easy for AI to generate. When I tried asking Claude (the AI I use for writing articles on this site) to “describe an e-commerce architecture in the C4 model,” the person, softwareSystem, and container hierarchy came out cleanly. However, the views block’s auto-layout settings and deployment node descriptions occasionally include syntax errors, so previewing in Structurizr Lite after generation is advisable.
DBML — Database Design as Code
DBML is a dedicated language for describing database schemas as text, developed by Holistics. Write table definitions and relations in concise syntax and ER diagrams are generated automatically.
It integrates with the web tool dbdiagram.io, enabling real-time ER diagram preview in the browser. DBML can also be converted to SQL.
Sample: Blog System Schema

Table users {
  id integer [pk, increment]
  username varchar [not null, unique]
  email varchar [not null, unique]
  password_hash varchar [not null]
  role varchar [default: 'user']
  created_at timestamp [default: `now()`]

  Note: 'User master table'
}

Table posts {
  id integer [pk, increment]
  title varchar [not null]
  body text
  status post_status [default: 'draft']
  user_id integer [not null]
  category_id integer
  published_at timestamp
  created_at timestamp [default: `now()`]
}

Table categories {
  id integer [pk, increment]
  name varchar [not null, unique]
  slug varchar [not null, unique]
}

Table comments {
  id integer [pk, increment]
  body text [not null]
  post_id integer [not null]
  user_id integer [not null]
  created_at timestamp [default: `now()`]
}

Enum post_status {
  draft
  published
  archived
}

Ref: posts.user_id > users.id
Ref: posts.category_id > categories.id
Ref: comments.post_id > posts.id
Ref: comments.user_id > users.id
[pk] marks primary keys; > means many-to-one; < means one-to-many; - means one-to-one. TableGroup enables logical grouping.
Pros and Cons
Compared to a pile of CREATE TABLE statements, DBML schema definitions are far more readable and writable. Auto-generated ER diagrams, SQL conversion (PostgreSQL/MySQL), and reverse conversion from SQL make it easy to move back and forth between design and implementation.
The scope is limited to database design only. Visual ER diagram preview depends on dbdiagram.io, making fully offline use inconvenient. That said, for DB design specifically, DBML beats Mermaid’s ER diagram in expressiveness — once you have more than 10 tables, DBML tends to win out.
AI Compatibility
DBML appears to be a format AI finds quite easy to write. Prompt “design the DB schema for a blog system in DBML” and you get back a practical schema including table definitions, relations, and indexes. Particularly handy is conversion from existing SQL — paste a CREATE TABLE statement and ask “convert this to DBML” for an almost-accurate conversion. DB design is one of the domains where AI excels most.
Diagrams (Python) — Cloud Architecture Diagrams in Python
Diagrams is a Python library for drawing cloud architecture diagrams as code. Over 500 official icons from AWS, GCP, Azure, and Kubernetes are built in, enabling professional diagrams from code alone. Internally it uses Graphviz.
Sample: AWS Web Application Architecture

from diagrams import Diagram, Cluster
from diagrams.aws.compute import ECS
from diagrams.aws.database import RDS, ElastiCache
from diagrams.aws.network import ELB, CloudFront, Route53
from diagrams.aws.storage import S3

with Diagram("Web Application Architecture", show=False):
    dns = Route53("Route 53")
    cdn = CloudFront("CloudFront")
    lb = ELB("ALB")

    with Cluster("ECS Cluster"):
        svc = [ECS("App 1"), ECS("App 2"), ECS("App 3")]

    db = RDS("PostgreSQL")
    cache = ElastiCache("Redis")
    storage = S3("Static Assets")

    dns >> cdn >> lb >> svc
    svc >> db
    svc >> cache
    cdn >> storage
Use the >> operator for connections and Cluster() for grouping.
Sample: Microservices Architecture

from diagrams import Diagram, Cluster
from diagrams.aws.compute import ECS, Lambda
from diagrams.aws.database import RDS, DynamoDB
from diagrams.aws.integration import SQS, SNS
from diagrams.aws.network import APIGateway

with Diagram("Microservices", show=False, direction="TB"):
    api_gw = APIGateway("API Gateway")

    with Cluster("Auth Service"):
        auth = ECS("Auth")
        auth >> RDS("Auth DB")

    with Cluster("Product Service"):
        product = ECS("Product")
        product >> DynamoDB("Product DB")

    with Cluster("Order Service"):
        order = ECS("Order")
        order >> RDS("Order DB")

    api_gw >> [auth, product, order]
    order >> SQS("Queue") >> Lambda("Notify") >> SNS("Topic")
Multi-cloud architecture diagrams mixing AWS, GCP, and Azure icons can be drawn in a single script.
Pros and Cons
Anyone who has manually placed AWS icons one by one in PowerPoint or draw.io will appreciate having 500+ official cloud icons ready to go. Because it is Python code, you can loop to generate the same architecture for multiple environments, or manage infrastructure diagrams in the same repository as Terraform — a natural workflow for developers.
Setup requires both Python and Graphviz, adding some overhead. And of course, it is specialized for cloud architecture diagrams — for flowcharts or sequence diagrams, a separate tool is needed.
AI Compatibility
Python code is easy for AI to generate, so “draw a serverless AWS architecture using Diagrams” produces everything from import statements to the with Diagram block. The one issue is that AI occasionally generates icon class names that don’t exist, so checking against the official icon list is necessary. The >> operator chain for connections is almost never wrong, so verifying the import statements is usually enough.
Selection Guide
| Your situation | Recommendation |
|---|---|
| Want to systematically document architecture | Structurizr |
| Need diagrams at multiple levels of abstraction | Structurizr |
| Want to manage database ER diagrams | DBML |
| Want to keep SQL and schema definitions in sync | DBML |
| Want to draw AWS/GCP/Azure architecture diagrams | Diagrams (Python) |
| Want to manage diagrams in the same repo as infrastructure code | Diagrams (Python) |
Practical Tips: Integrating Design Tools into Your Development Flow
Using DBML as the Canonical Schema Definition
DBML can serve not just for ER diagram visualization, but as the official schema definition file. An example development workflow:
1. Ask AI: "Design the user management DB schema in DBML"
2. Review the output DBML with the team (Git PR)
3. Generate SQL migration with dbml2sql
4. Auto-generate ER diagrams via dbdiagram.io or CI
Reverse engineering from an existing DB is also possible with sql2dbml, so it can be used to visualize legacy databases.
Managing Diagrams (Python) in the Same Repository as Infrastructure Code
It is recommended to place a diagrams/ folder alongside your Terraform/CDK and other infrastructure code, and manage architecture diagrams as Python scripts. Including diagram updates in the same PR as infrastructure changes reduces the risk of code and diagram falling out of sync.
Installation
Structurizr
# Lite version (Docker)
docker run -it --rm -p 8080:8080 -v ./:/usr/local/structurizr structurizr/lite

# CLI version
java -jar structurizr-cli.jar export -workspace workspace.dsl -format plantuml
DBML
# CLI tool
npm install -g @dbml/cli

# DBML to SQL
dbml2sql schema.dbml --postgres -o schema.sql

# SQL to DBML
sql2dbml schema.sql --postgres -o schema.dbml
Visit dbdiagram.io in a browser to use it without installation.
Diagrams (Python)
# Install Graphviz (required)
brew install graphviz  # macOS
sudo apt install graphviz  # Ubuntu

# Install Diagrams
pip install diagrams

# Run
python architecture.py
Related Articles
Summary
This article compared 3 domain-specific design tools as code-manageable visualizations for the AI era.
What these 3 tools share is that specialization in a particular domain delivers greater efficiency than general-purpose tools. For systematic architecture documentation use Structurizr, for DB design use DBML, and for cloud architecture diagrams use Diagrams (Python) — when the use case is clear, these are easier to work with.
And since all three have excellent AI compatibility, the experience of “just describing your design intent and receiving code output” is genuinely within reach.
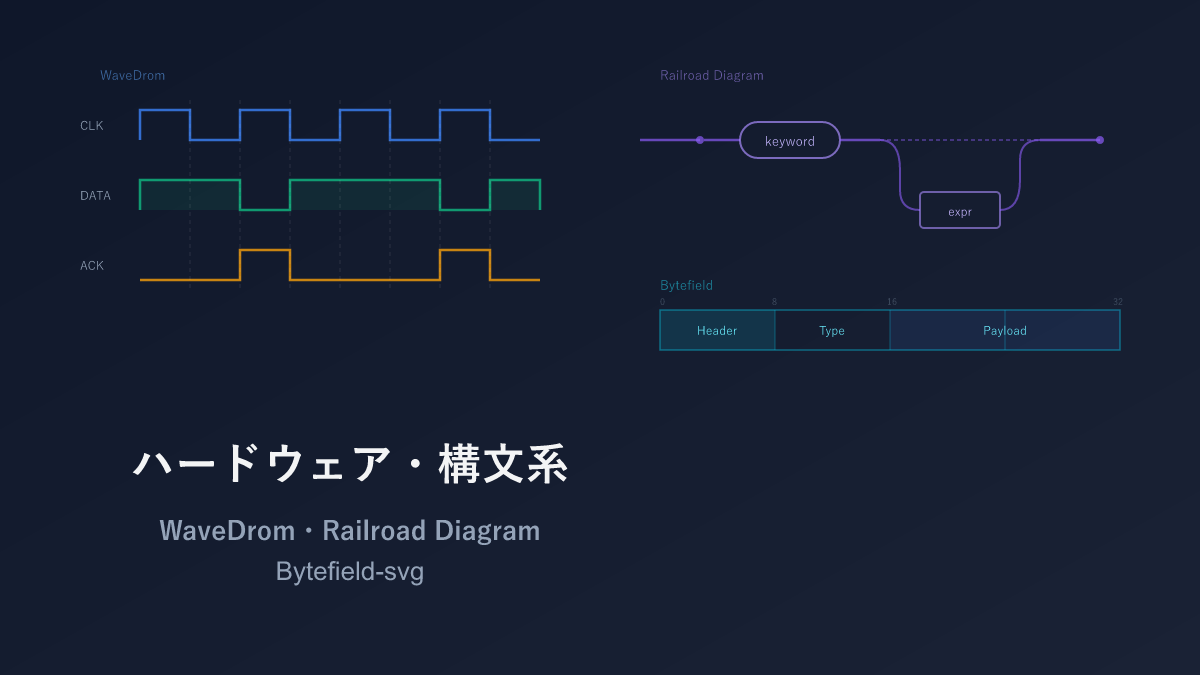
Next up: Domain-specific hardware and syntax tools — WaveDrom, Railroad Diagram, and Bytefield.
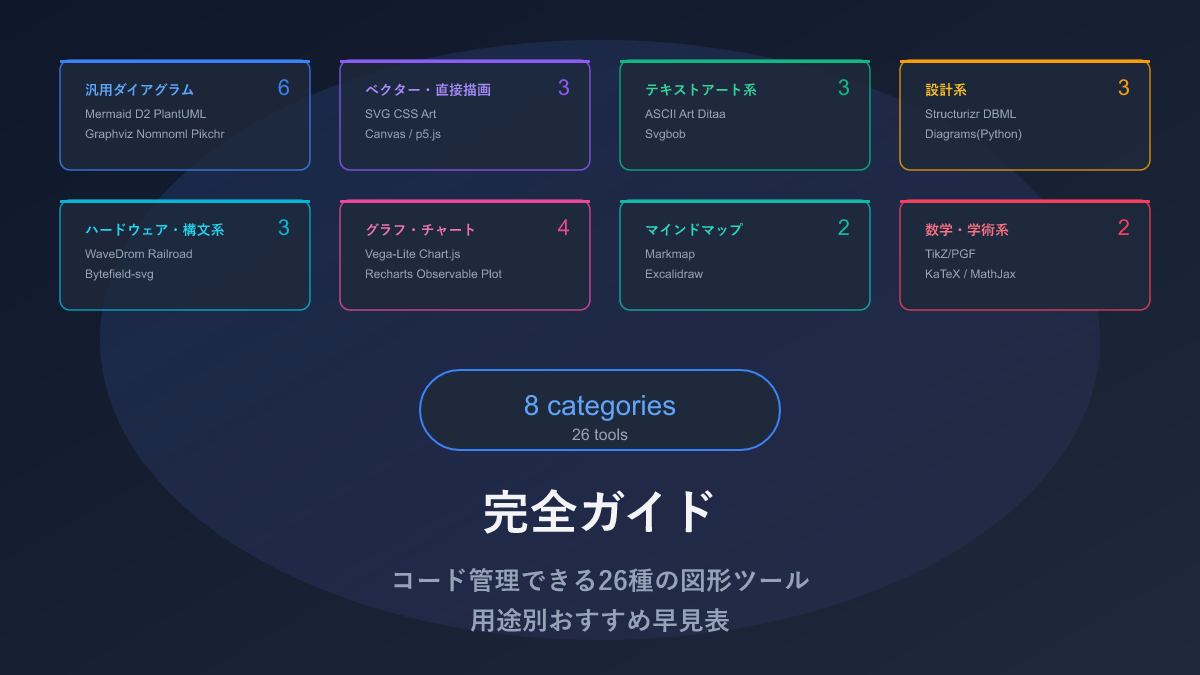
Series Index → Complete Guide to Diagrams in the AI Era
For further details, see the official sites: Structurizr / DBML / Diagrams
Thank you for reading. We hope to see you in the next article.