Thank you for visiting this site. This article provides a cross-cutting comparison of all 26 code-manageable diagram tools for the AI era and summarizes recommendations by use case.
With 26 tools, you are probably thinking “so which one should I actually use?” — this article tells you exactly that. Each category table has a link to the detailed article below it, so follow those links for anything that catches your interest.
What Does “Managing Diagrams as Code” Mean?
When you create a diagram in PowerPoint or draw.io, what gets saved is a binary file (a data format humans cannot read). Binary files come with awkward problems:
- Contents are unreadable — opening the file reveals a sequence of 0s and 1s; there is no way to tell what is where
- Changes cannot be seen — a Git diff only shows “something changed” — you cannot distinguish “one arrow was added” from “the whole thing was rebuilt”
- AI cannot generate them — AI is a text-output tool and cannot directly generate binary images
- The original tool is needed to edit — a diagram made in PowerPoint cannot be modified without PowerPoint
By contrast, the tools in this article define diagrams as text (code). For example, in Mermaid, writing the following text auto-generates a flowchart:

flowchart TD
  A[Start] --> B{Condition}
  B -->|Yes| C[Process A]
  B -->|No| D[Process B]
Because it is text, you can ask AI to “draw this diagram”, Git diffs show exactly which arrows were added, and anyone with a text editor can modify it.
With AI coding assistants now ubiquitous, I am convinced that the scope for code-managed diagrams will only expand going forward. Diagrams auto-updating in sync with documentation changes, diagram diffs visible in PR reviews, design discussions with AI that return specification-ready diagrams — all of this is already achievable, and will become even more natural as tools and AI continue to evolve.
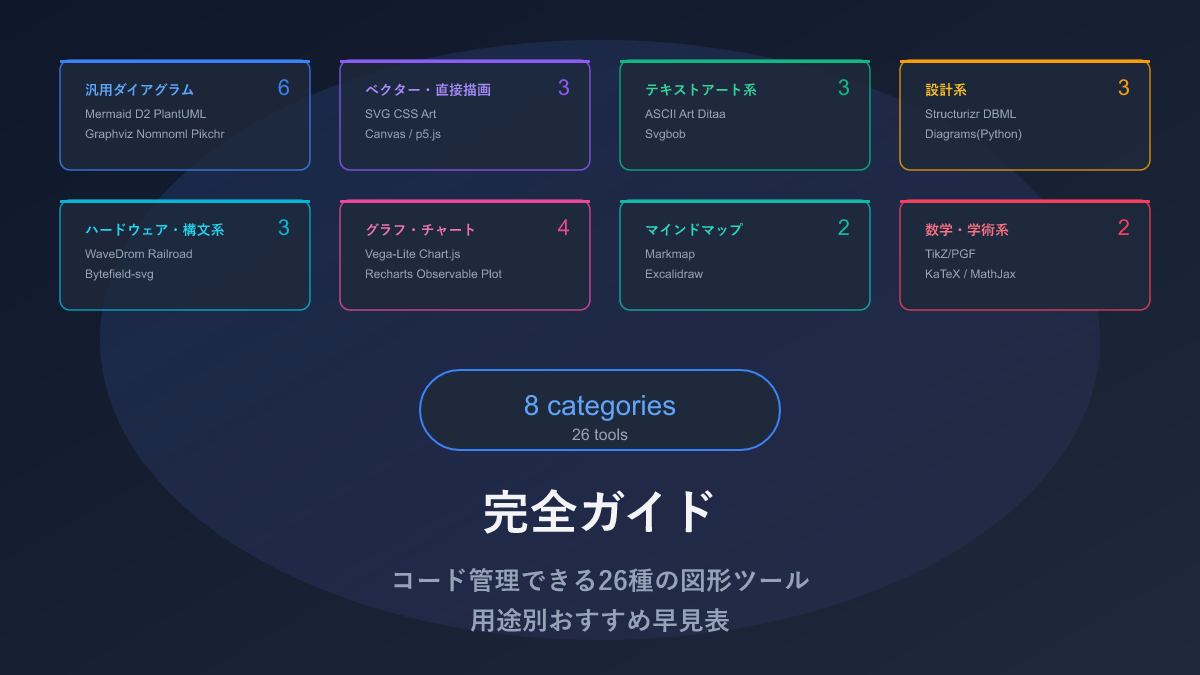
Quick Reference: All 26 Tools
Below is a quick-reference table of all 26 tools across 8 categories. For anything of interest, follow the link below each category table for sample code and full details.
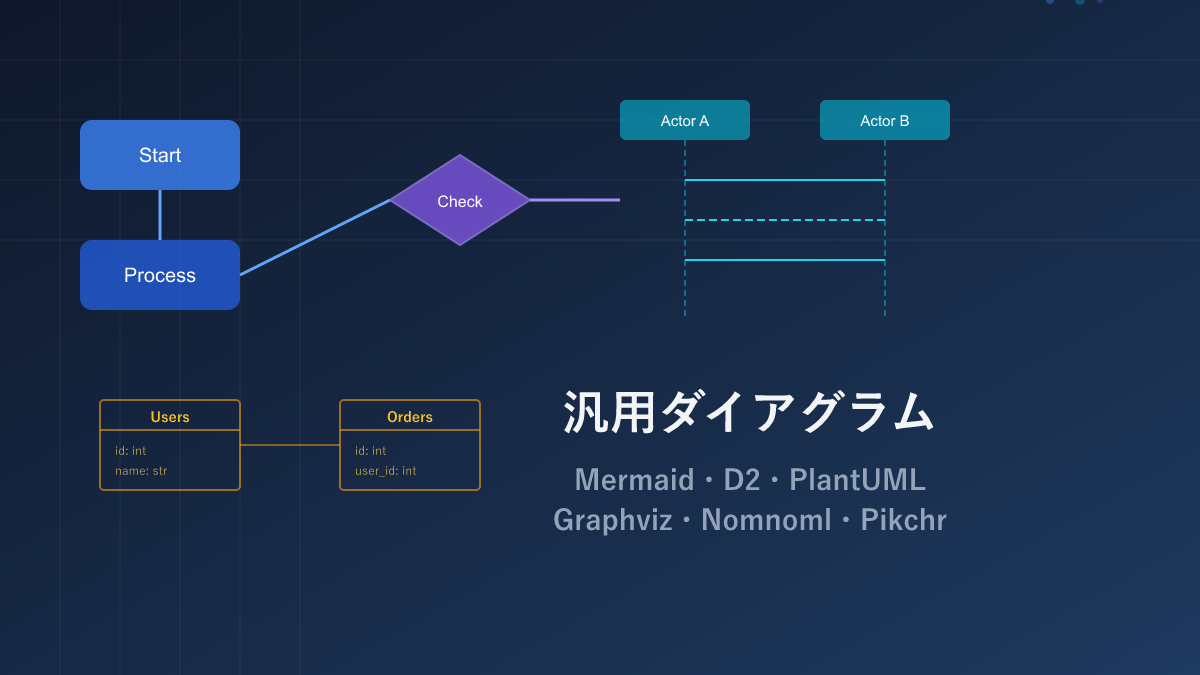
General-Purpose Diagrams (6 tools)
The go-to tools for flowcharts, sequence diagrams, ER diagrams, and other common development diagrams.
| Name | Syntax | AI Compatibility | Diagram Types | Highlights |
|---|---|---|---|---|
| Mermaid | Custom | ◎ | Flowchart, sequence, ER, Gantt, state machine, and 10+ more | Embeds directly in GitHub. Start here if in doubt |
| D2 | Custom | ◎ | Flowchart, architecture, nested structure diagrams | Excellent nesting syntax. Modern look |
| PlantUML | Custom | ○ | Almost all UML types (class, sequence, use-case, etc.) | Suitable for formal UML-compliant documentation |
| Graphviz | DOT language | ○ | Node-and-edge graphs (dependencies, data structures) | Auto-layouts large numbers of nodes cleanly |
| Nomnoml | Custom | ○ | Class and object diagrams | Runs in the browser with no setup. Handy for quick sketches |
| Pikchr | PIC-based | △ | Coordinate-based custom diagrams | Pixel-level layout control. For advanced users |
For sample code, pros and cons, and full details, see:
Vector and Direct Drawing (3 tools)
Techniques for specifying coordinates and styles yourself to draw shapes. Expressive power is high, but code volume is large — best used as a supplement to general-purpose tools.
| Name | Syntax | AI Compatibility | What You Can Draw | Highlights |
|---|---|---|---|---|
| SVG | XML | ○ | Any shape (icons, logos, diagrams, etc.) | No degradation on zoom. Also used as an output format by other diagram tools |
| CSS Art | CSS | △ | UI parts, icons, decorations | No extra software needed — just HTML and CSS |
| Canvas / p5.js | JavaScript | ○ | Animations, interactive figures that respond to mouse input | Create moving and touchable diagrams |
For sample code, pros and cons, and full details, see:

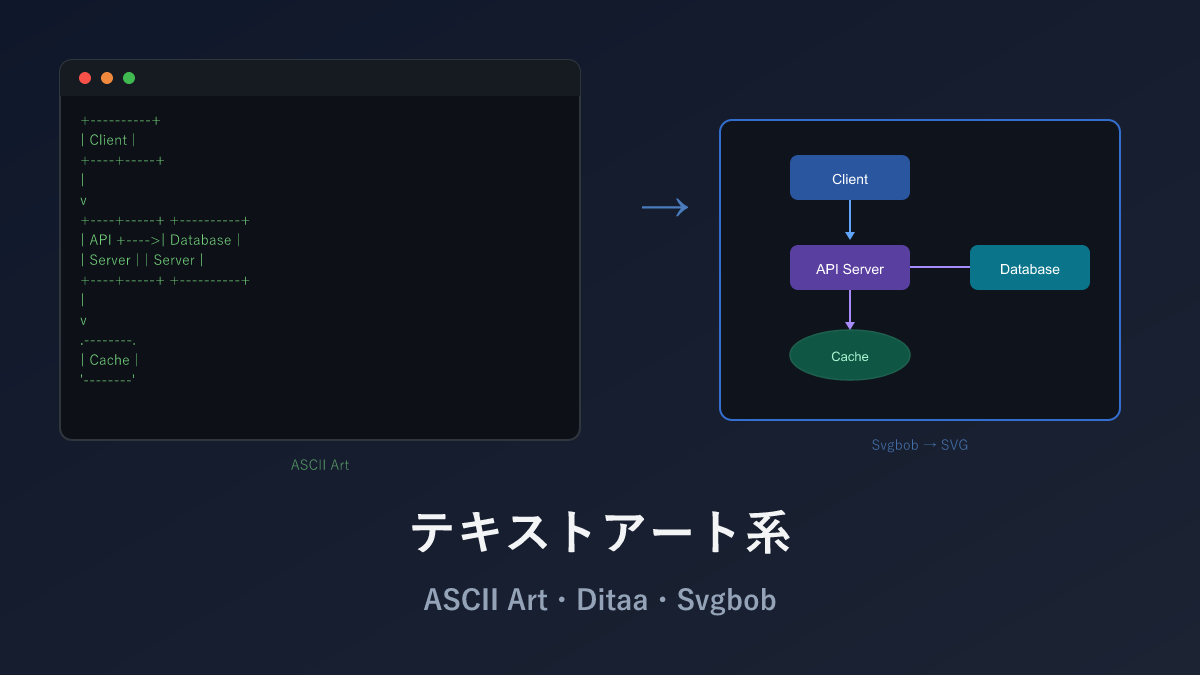
Text Art (3 tools)
Drawing diagrams using only characters like +, -, |. No dedicated software required, and AI compatibility is good.
| Name | Syntax | AI Compatibility | What You Can Draw | Highlights |
|---|---|---|---|---|
| ASCII Art | Text | ◎ | Diagrams composed purely of characters | No dedicated software needed. Embeds in source code comments |
| Ditaa | Text | ◎ | ASCII art → image (PNG) conversion | Converts character diagrams to hand-drawn-style images |
| Svgbob | Text | ◎ | ASCII art → clean SVG conversion | Higher quality than Ditaa. Also handles curves |
For sample code, pros and cons, and full details, see:
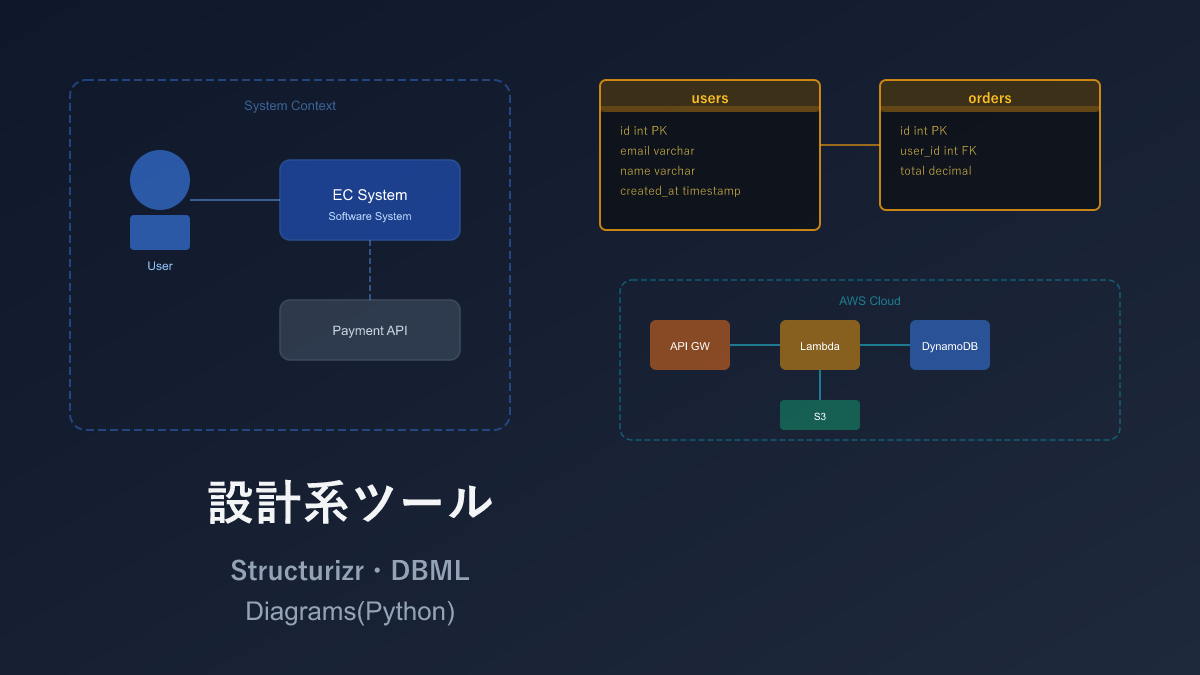
Design-Specific (3 tools)
Domain-specific dedicated tools. They deliver expressive power and productivity in their respective areas that no general-purpose tool can match.
| Name | Syntax | AI Compatibility | Diagram Types | Highlights |
|---|---|---|---|---|
| Structurizr DSL | Custom DSL | ◎ | System-wide architecture (4 zoom levels) | Auto-generates from high-level to detailed views from a single definition |
| DBML | Custom | ◎ | Database table relationship diagrams (ER diagrams) | Auto-generates ER diagrams; can also convert to SQL |
| Diagrams (Python) | Python | ◎ | Cloud architecture diagrams (AWS/GCP/Azure) | 500+ official cloud icons built in |
For sample code, pros and cons, and full details, see:
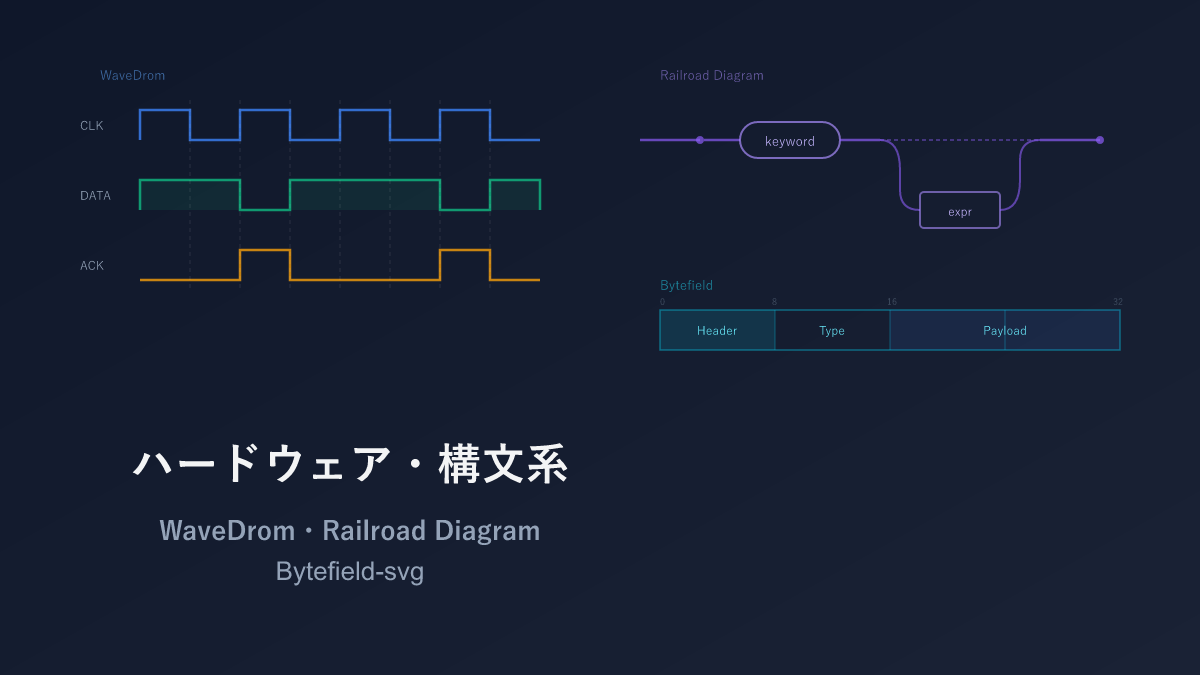
Hardware and Syntax (3 tools)
Quite niche content. Feel free to skip if digital circuit timing diagrams or protocol specifications are not your domain.
| Name | Syntax | AI Compatibility | Diagram Types | Highlights |
|---|---|---|---|---|
| WaveDrom | JSON | ○ | Digital signal waveform diagrams (timing charts) | For hardware design and protocol specifications |
| Railroad Diagram | JavaScript / Python | ○ | Programming language syntax diagrams (railway-style diagrams) | For explaining language specs and API argument patterns |
| Bytefield-svg | Custom | △ | Communication packet byte structure diagrams | For network protocol specifications |
For sample code, pros and cons, and full details, see:
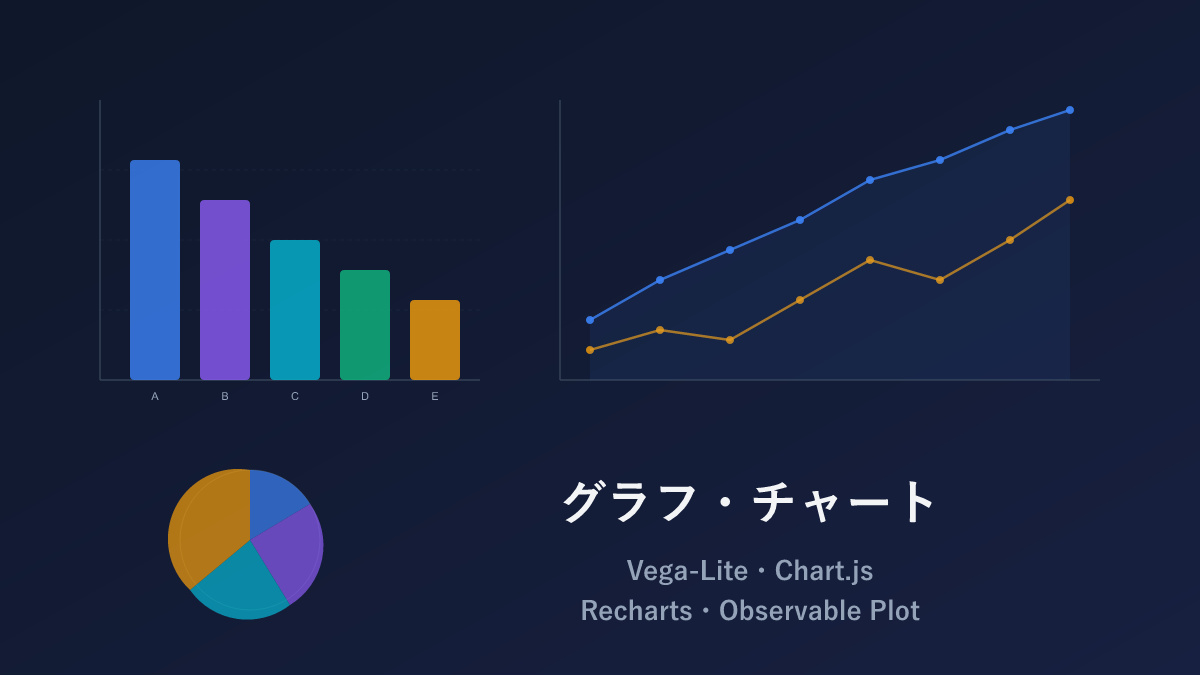
Charts and Graphs (4 tools)
The go-to tools for bar charts, line charts, pie charts, and other data visualization.
| Name | Syntax | AI Compatibility | Chart Types | Highlights |
|---|---|---|---|---|
| Vega-Lite | JSON | ◎ | Bar, line, scatter, heatmap, and many more | JSON-defined. Excellent AI compatibility |
| Chart.js | JavaScript | ◎ | Bar, line, pie, radar, scatter, and more | Widely used; abundant information available |
| Recharts | JSX (React) | ○ | Bar, line, pie, radar, area, and more | Integrates naturally into React apps |
| Observable Plot | JavaScript | ○ | Bar, line, scatter, density estimation, and more | High-quality output with minimal code. Designed by the D3.js creator |
For sample code, pros and cons, and full details, see:
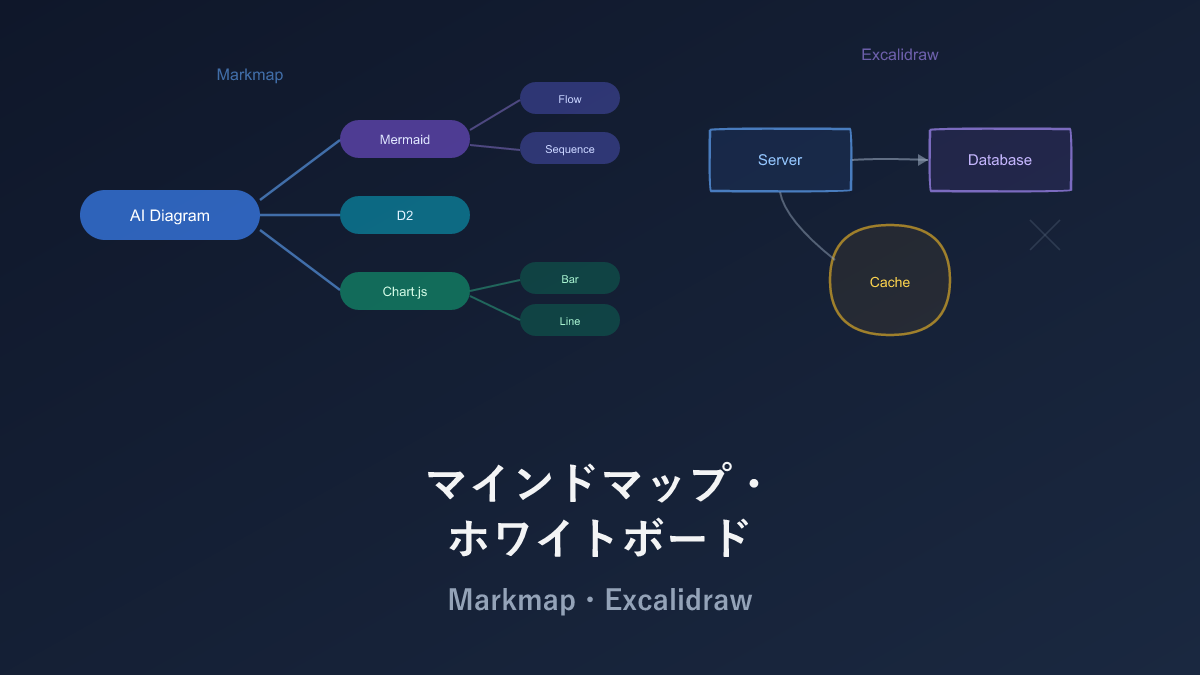
Mind Map and Whiteboard (2 tools)
Suited for organizing thoughts and rough sketches. Markmap auto-generates from text; Excalidraw draws intuitively with a mouse.
| Name | Syntax | AI Compatibility | What You Can Draw | Highlights |
|---|---|---|---|---|
| Markmap | Markdown | ◎ | Mind maps from Markdown | Visualize AI output directly |
| Excalidraw | GUI (saved as JSON) | △ | Free-form hand-drawn-style diagrams | Draw intuitively with a mouse. Great for rough sketches |
For sample code, pros and cons, and full details, see:
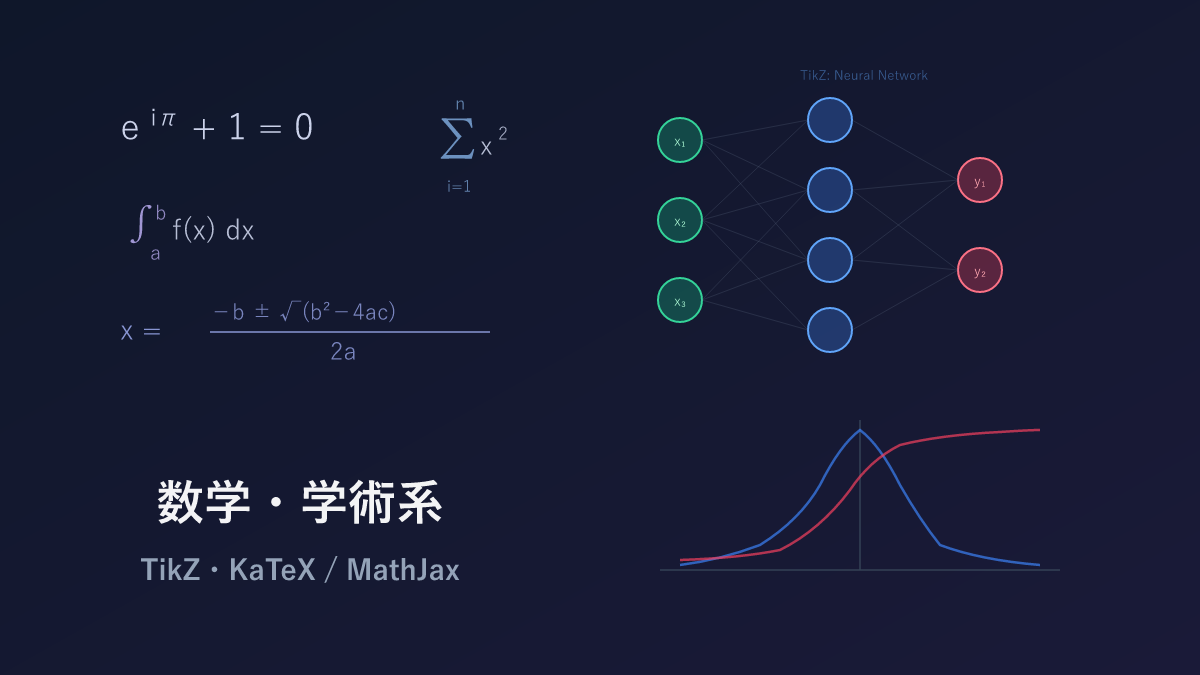
Math and Academic (2 tools)
Diagram and notation tools used in academic papers and textbooks.
| Name | Syntax | AI Compatibility | What You Can Draw | Highlights |
|---|---|---|---|---|
| TikZ/PGF | LaTeX | ◎ | Any diagram at academic paper quality | The world standard in LaTeX environments. Vast domain-specific library ecosystem |
| KaTeX / MathJax | LaTeX | ◎ | Mathematical notation on the web | AI generates with high accuracy |
For sample code, pros and cons, and full details, see:
Recommendations by Use Case
If the tables above leave you undecided, use the following as a reference.
| What you want to do | Recommendation |
|---|---|
| Just need a diagram | Mermaid — embeds in GitHub, easy for AI to generate |
| Draw an architecture diagram | D2 — natural nesting syntax. For cloud icons, use Diagrams (Python) |
| Need a database ER diagram | DBML — specialized for ER diagrams. Can also convert to SQL |
| Need a data chart | Vega-Lite (if AI will generate) / Chart.js (if embedding in a web app) |
| Need a figure for an academic paper | TikZ — the standard in LaTeX environments |
| Want to organize your thinking | Markmap — just write Markdown and it becomes a mind map |
| Need a rough sketch | Excalidraw — draw intuitively with a mouse |
| Want to embed a diagram in source code comments | ASCII Art — no dedicated software, works in any text editor |
Where You Will Display It
| Display target | Recommendation |
|---|---|
| GitHub README | Mermaid (native support) |
| Website / blog | SVG, Mermaid, KaTeX |
| Academic paper | TikZ |
| Presentation | Excalidraw, Diagrams (Python) |
| Inside source code | ASCII Art |
Choose by Diagram Type
| Diagram type | Recommendation |
|---|---|
| Flowchart | Mermaid, D2 |
| Sequence diagram | Mermaid, PlantUML |
| ER diagram | DBML, Mermaid |
| Class diagram | PlantUML, Mermaid |
| Architecture diagram | D2, Diagrams (Python) |
| Dependency graph | Graphviz |
| Data chart | Vega-Lite, Chart.js |
| Mind map | Markmap |
| Mathematical notation | KaTeX / MathJax |
Kroki — One Service for Multiple Tools
When you want to use multiple tools introduced so far from a single service, Kroki is a handy option.
Kroki is a rendering service that provides access to 20+ diagram tools through a single API. It supports Mermaid, PlantUML, Graphviz, D2, Svgbob, WaveDrom, and many other tools covered in this article.
Usage is simple — specify the tool name in the URL path and send the code:
# Generate a Mermaid flowchart
curl -X POST https://kroki.io/mermaid/svg \
  -d 'flowchart TD
    A[Start] --> B{Check}
    B -->|Yes| C[Process]
    B -->|No| D[End]'

# Generate a PlantUML sequence diagram
curl -X POST https://kroki.io/plantuml/svg \
  -d '@startuml
Alice -> Bob: Hello
Bob --> Alice: Hi
@enduml'
No tool installation whatsoever — just hit the HTTP API to get a diagram. docker run -d -p 8000:8000 yuzutech/kroki enables self-hosting, so it can be operated in a closed internal network.
Dependency on an external service means the official server going down stops diagram generation (avoidable with self-hosting).
Summary
This article introduced all 26 code-manageable diagram tools for the AI era, organized into 8 categories.
Honestly, there is no need to memorize all 26. Personally, I only use 4–5 tools regularly — the rest I pull out only when the need arises. What matters is having “I know tools like this exist” somewhere in the back of your mind, so that when the moment comes you can recall “right, there was a tool for this.”
Start with Mermaid, and add DBML, Diagrams (Python), Vega-Lite, and other specialized tools as needed — that progression works perfectly. If you end up using multiple tools, unifying via Kroki’s API is also a good strategy.
I hope this article helps you choose the right diagram tool for your needs.
Thank you for reading. We hope to see you in the next article.