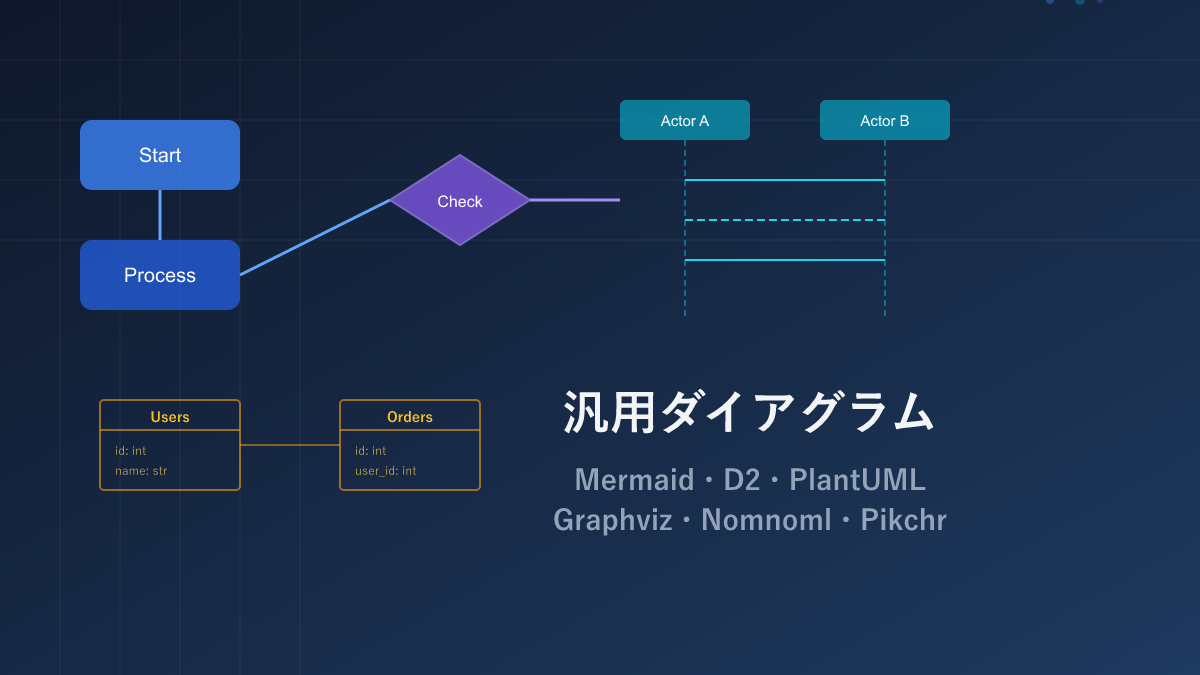
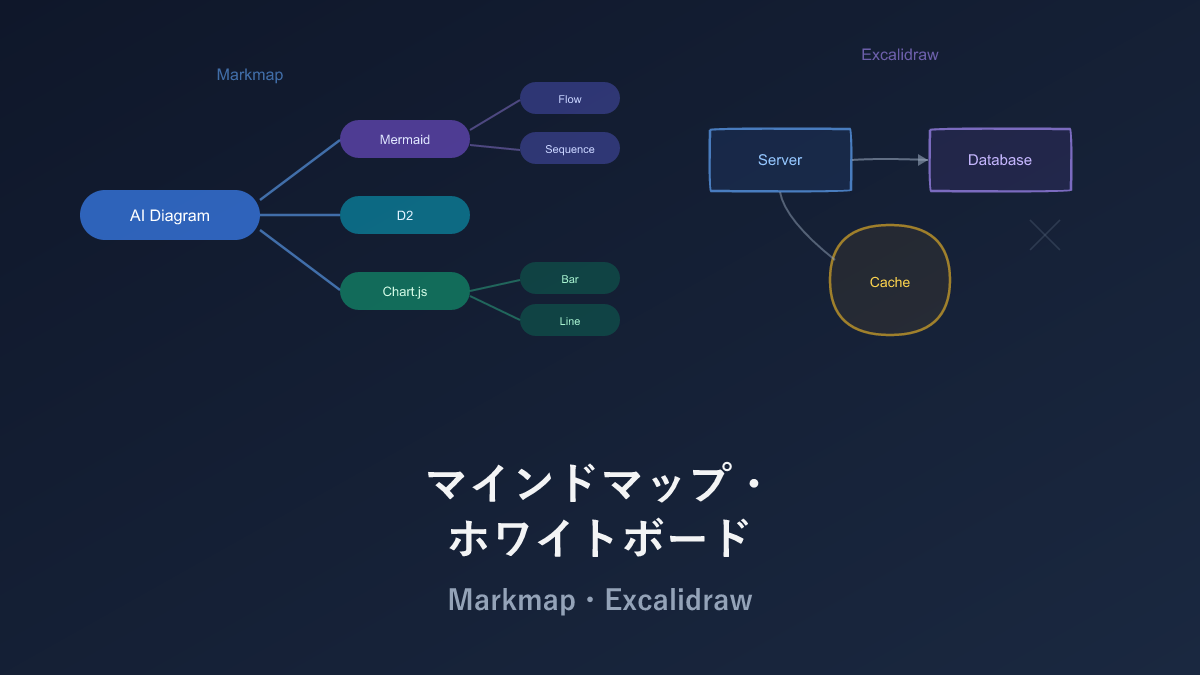
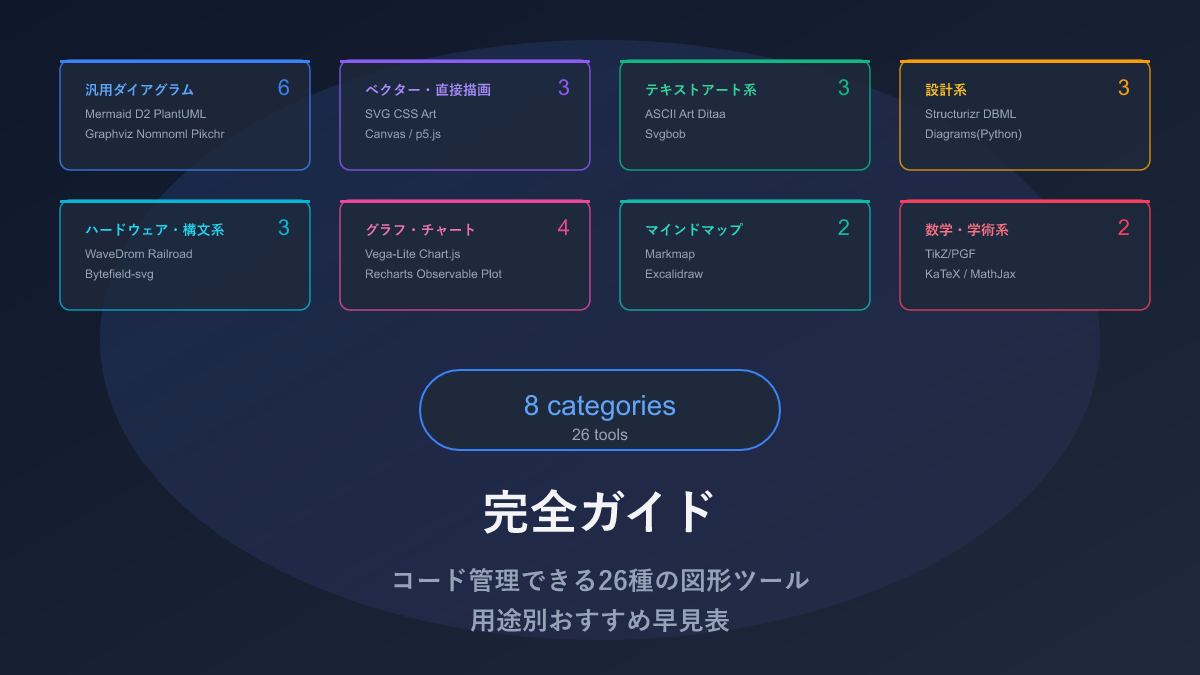
Thank you for visiting this site. This article is the eighth installment in the series on code-manageable diagrams for the AI era, covering 2 math and academic tools. For the full series index, see the Complete Guide.
Diagram and notation tools used in academic papers and textbooks have a very different character from software development diagram tools. What is required here is publication-quality output, integration with mathematical notation, and mathematical precision.
Note that KaTeX/MathJax are not strictly diagram tools, but since they fit the series theme of “generating visual representations from text,” they are included here.
In the AI era, mathematical notation generation is one of AI’s strongest areas. For requests like “write this differential equation in LaTeX” or “express this loss function as a formula,” highly accurate output comes back. There is little need to write mathematical notation manually in papers or blog posts — letting AI handle it and rendering with KaTeX/MathJax is the efficient approach. For TikZ too, AI’s ability to generate structured code has softened the steep learning curve.
Comparison Table
| Name | Syntax | AI Compatibility | What You Can Draw | Highlights |
|---|---|---|---|---|
| TikZ/PGF | LaTeX | ◎ | Any diagram at academic paper quality | The world standard in LaTeX environments. Vast domain-specific library ecosystem |
| KaTeX/MathJax | LaTeX | ◎ | Mathematical notation on the web | AI generates with high accuracy |
TikZ/PGF — The World Standard for Academic Quality
TikZ/PGF is a package for rendering high-quality vector diagrams in LaTeX environments, and has established itself as the world standard for figures in academic papers, textbooks, and technical books.
Programmatic rendering using \foreach loops and conditionals is possible, and there are vast domain-specific libraries: circuitikz (circuit diagrams), pgfplots (graphs), forest (trees), and many more.
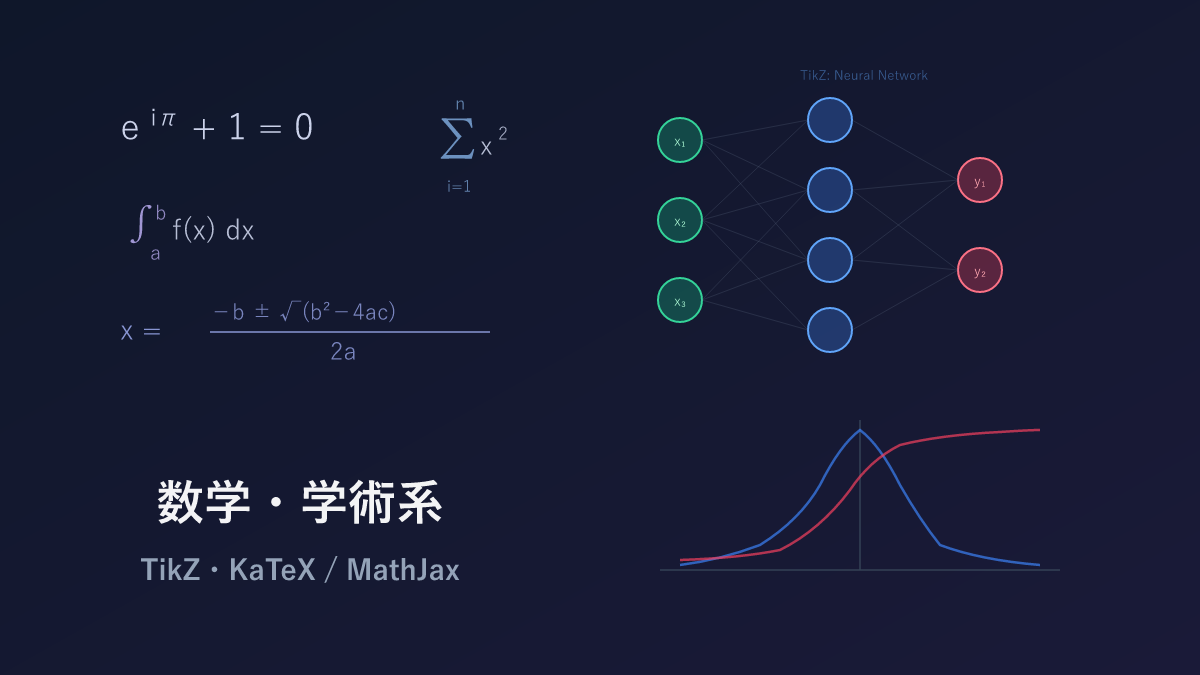
Sample: Neural Network


\begin{tikzpicture}[
  neuron/.style={circle, draw, minimum size=1cm, fill=blue!20},
  input/.style={neuron, fill=green!20},
  output/.style={neuron, fill=red!20}
]
\foreach \i in {1,...,3}
  \node[input] (i\i) at (0, -\i*1.5) {$x_\i$};
\foreach \j in {1,...,4}
  \node[neuron] (h\j) at (3, -\j*1.2+0.3) {$h_\j$};
\foreach \k in {1,...,2}
  \node[output] (o\k) at (6, -\k*1.5-0.5) {$y_\k$};
\foreach \i in {1,...,3}
  \foreach \j in {1,...,4}
    \draw[->] (i\i) -- (h\j);
\foreach \j in {1,...,4}
  \foreach \k in {1,...,2}
    \draw[->] (h\j) -- (o\k);
\end{tikzpicture}
Sample: Function Graph (pgfplots)
\begin{tikzpicture}
\begin{axis}[
  xlabel={$x$}, ylabel={$f(x)$},
  grid=major, legend pos=north west
]
\addplot[blue, thick, domain=-3:3, samples=100] {exp(-x^2)};
\addlegendentry{$e^{-x^2}$}
\addplot[red, thick, domain=-3:3, samples=100] {1/(1+exp(-x))};
\addlegendentry{$\sigma(x)$}
\end{axis}
\end{tikzpicture}
Pros and Cons
The learning curve is quite steep — a prerequisite knowledge of LaTeX is assumed. Compilation is also slow, and producing a single finished figure can require many build-and-check cycles. Use in web environments is also limited.
Even so, TikZ continues to be used in academia because it produces academic-quality figures with fonts and styles perfectly unified with the LaTeX document. Domain-specific libraries — circuitikz (circuits), pgfplots (graphs), forest (trees) — are vast, and someone has usually written a package for whatever you want to do. For paper figures, it remains the first choice.
AI Compatibility
Thanks to the enormous volume of Q&A on TeX StackExchange and academic papers, LLM training data contains abundant TikZ code. Prompt “draw a neural network diagram in TikZ” and structured code using \foreach loops comes out, often compiling successfully.
However, the required \usepackage declarations sometimes go missing, so when compilation errors occur, check there first. For well-known packages like pgfplots, syntax is usually correct; for more obscure libraries, accuracy may drop.
KaTeX / MathJax — Mathematical Notation Rendering on the Web
KaTeX and MathJax are libraries for beautifully rendering LaTeX-formatted mathematical notation on the web. They are standard in GitHub, Obsidian, Notion, Jupyter Notebook, and many other tools.
| Item | KaTeX | MathJax |
|---|---|---|
| Rendering speed | Fast | Somewhat slower |
| Math notation range | Major LaTeX math | Almost all LaTeX math + other notations |
| Bundle size | Lightweight | Somewhat heavier |
| Developer | Khan Academy | MathJax Consortium |
The rule of thumb: KaTeX for speed, MathJax for compatibility.
Sample
% Quadratic formula
x = \frac{-b \pm \sqrt{b^2 - 4ac}}{2a}

% Euler's identity
e^{i\pi} + 1 = 0

% Neural network loss function
\mathcal{L} = -\frac{1}{N} \sum_{i=1}^{N} \left[ y_i \log(\hat{y}_i) + (1 - y_i) \log(1 - \hat{y}_i) \right]
Pros and Cons
GitHub, Obsidian, Notion, Jupyter Notebook — LaTeX math is available almost everywhere today, thanks to KaTeX and MathJax. The de facto standard for web-based mathematical notation, using the widely-known LaTeX notation for Git-manageable writing.
It is exclusively for rendering mathematical notation — no shapes at all — but this is a difference in scope rather than a weakness. Speed-focused use cases call for KaTeX; compatibility-focused use cases call for MathJax; together they cover everything math-related.
AI Compatibility
LaTeX math generation is a task where LLMs consistently produce accurate output. Requests like “write this differential equation in LaTeX” typically come back correctly. This is likely because LaTeX source from math papers and textbooks is well-represented in training data. I let AI handle any mathematical notation I need to write.
Selection Guide
| Your situation | Recommendation |
|---|---|
| Adding figures to academic papers | TikZ |
| Displaying math on the web | KaTeX (speed) / MathJax (compatibility) |
| Want AI to generate mathematical notation | KaTeX/MathJax |
| Want AI to generate academic-quality figures | TikZ |
Practical Tips: Getting Better TikZ from AI
When asking AI to generate TikZ code, these tips improve accuracy:
- Specify the library you want: say “using pgfplots” or “using circuitikz” to name the package explicitly
- Request complete compilable code: specifying “provide complete code from \documentclass to \end{document}” prevents missing
\usepackagedeclarations - Verify instantly in Overleaf: paste AI output into Overleaf for compile verification without a local LaTeX environment
The combination with Overleaf in particular is powerful: paste AI-generated TikZ into Overleaf, compile, feed corrections back to AI — this loop produces high-quality figures without needing a local LaTeX environment.
Installation
TikZ
Bundled with standard LaTeX distributions (TeX Live, MiKTeX, etc.). No installation needed with Overleaf.
KaTeX / MathJax
<!-- KaTeX -->
<link rel="stylesheet" href="https://cdn.jsdelivr.net/npm/katex/dist/katex.min.css">
<script src="https://cdn.jsdelivr.net/npm/katex/dist/katex.min.js"></script>

<!-- MathJax -->
<script src="https://cdn.jsdelivr.net/npm/mathjax@3/es5/tex-mml-chtml.js"></script>
Related Articles
Summary
This article compared 2 math and academic tools as code-manageable visualizations for the AI era.
TikZ remains the world standard for academic-quality figures today, a position unlikely to change anytime soon. For web-based math, KaTeX/MathJax is the de facto standard.
In terms of AI compatibility, KaTeX/MathJax (LaTeX math) leads — it is one of the tasks LLMs handle with highest accuracy. TikZ also achieves high generation accuracy thanks to the vast TeX StackExchange dataset.
The next article is the final installment of the series — a summary article comparing all tools across categories.
Series Index → Complete Guide to Diagrams in the AI Era
For further details, see the official sites: TikZ / KaTeX / MathJax
Thank you for reading. We hope to see you in the next article.