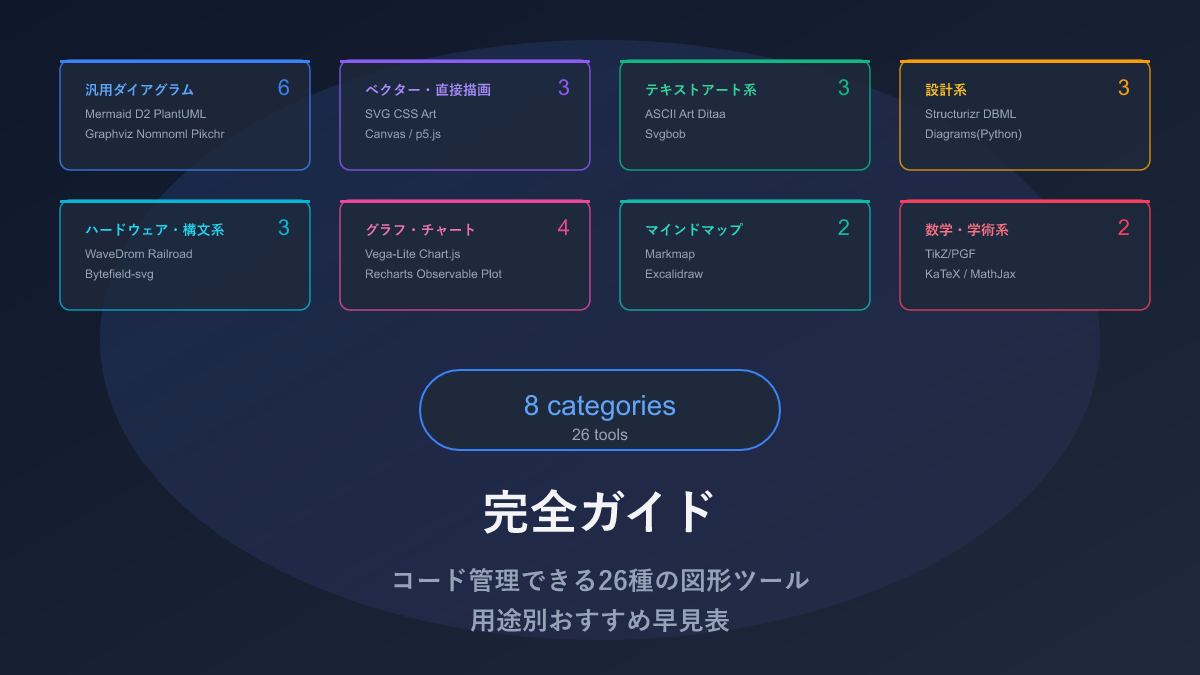
Thank you for visiting this site. This article is the second installment in the series on code-manageable diagrams for the AI era, covering 3 vector and direct-drawing tools. For the full series index, see the Complete Guide.
The Mermaid and D2 tools introduced previously were “write text and the layout happens automatically” — but the tools in this article take a different approach: specifying coordinates and styles yourself to draw shapes.
The expressive power is incomparably higher, but so is the amount of code required. To be honest, using these as your primary diagramming tool is more trouble than it’s worth, so it’s more realistic to treat them as supplements for “expressions that Mermaid or D2 can’t achieve.”
In the AI era, however, the weakness of “high code volume” is substantially mitigated. AI is adept at generating SVG and Canvas API code, so describing what you want in natural language produces dozens of lines of code instantly. SVG and Canvas, which were previously too laborious to consider, are becoming genuinely practical thanks to AI.
Comparison Table
| Name | Syntax | AI Compatibility | What You Can Draw | Highlights |
|---|---|---|---|---|
| SVG | XML | ○ | Any shape (icons, logos, diagrams, etc.) | No degradation on zoom. Also used as an output format by other diagram tools |
| CSS Art | CSS | △ | UI parts, icons, decorations | No extra software needed — just HTML and CSS |
| Canvas / p5.js | JavaScript | ○ | Animations, interactive figures that respond to mouse input | Create moving and touchable diagrams |
SVG — Crystal-Clear at Any Zoom Level
SVG is an image format that never blurs no matter how much you zoom in, supported natively by every browser. Unlike PNG or JPEG — which are collections of pixels — SVG defines images as a set of instructions like “draw a rectangle at (10, 10) with width 200,” so the image is recalculated and displayed crisp at any size.
Most of the tools introduced previously — Mermaid, D2, Graphviz — ultimately output SVG, making it the de facto “common output format” for code-managed diagrams. It is a text file and can be Git-managed, and it can be embedded directly into HTML.
Sample: Basic Shapes

<svg width="400" height="200" xmlns="http://www.w3.org/2000/svg">
  <!-- Rectangle -->
  <rect x="10" y="10" width="120" height="80"
        fill="#e3f2fd" stroke="#1976d2" stroke-width="2" rx="8"/>
  <text x="70" y="55" text-anchor="middle"
        font-size="14" fill="#1976d2">Server</text>

  <!-- Circle -->
  <circle cx="250" cy="50" r="40"
          fill="#e8f5e9" stroke="#388e3c" stroke-width="2"/>
  <text x="250" y="55" text-anchor="middle"
        font-size="14" fill="#388e3c">DB</text>

  <!-- Arrow line -->
  <defs>
    <marker id="arrowhead" markerWidth="10" markerHeight="7"
            refX="10" refY="3.5" orient="auto">
      <polygon points="0 0, 10 3.5, 0 7" fill="#666"/>
    </marker>
  </defs>
  <line x1="130" y1="50" x2="205" y2="50"
        stroke="#666" stroke-width="2"
        marker-end="url(#arrowhead)"/>
</svg>
Place basic shapes (rect, circle, line, polygon, etc.) at coordinates. Arrows are defined with a marker element.
Sample: SVG with CSS Animation
<svg width="300" height="100" xmlns="http://www.w3.org/2000/svg">
  <style>
    .pulse {
      animation: pulse 2s ease-in-out infinite;
    }
    @keyframes pulse {
      0%, 100% { r: 20; opacity: 1; }
      50% { r: 30; opacity: 0.6; }
    }
    .data-flow {
      stroke-dasharray: 10 5;
      animation: flow 1s linear infinite;
    }
    @keyframes flow {
      to { stroke-dashoffset: -15; }
    }
  </style>

  <circle class="pulse" cx="50" cy="50" r="20"
          fill="#4caf50"/>
  <text x="50" y="55" text-anchor="middle"
        font-size="10" fill="white">Running</text>

  <line class="data-flow" x1="80" y1="50" x2="200" y2="50"
        stroke="#2196f3" stroke-width="3"/>

  <rect x="210" y="30" width="80" height="40"
        fill="#fff3e0" stroke="#ff9800" stroke-width="2" rx="4"/>
  <text x="250" y="55" text-anchor="middle"
        font-size="12" fill="#e65100">Processing</text>
</svg>
Pros and Cons
Where Mermaid or D2 draws an arrow with A -> B, SVG requires 10+ lines including marker definitions. The verbosity and total lack of automatic layout are significant drawbacks for diagram purposes.
Even so, SVG is indispensable because it is the only vector image format natively supported by every browser as a web standard. No extra library needed, no degradation at any zoom level, and you can even add CSS and JavaScript animations. Since tools like Mermaid often output SVG as their final format, knowing SVG lets you make fine-grained adjustments — a quietly powerful advantage.
AI Compatibility
For diagrams at the level of stacking rect and circle elements, AI produces usable SVG. In fact, the basic-shapes sample in this article was drafted by AI.
However, when it comes to Bézier curves in path elements (coordinate data like d="M... C..."), AI accuracy drops sharply. Coordinate calculation is a known weakness of LLMs, so “draw a simple shape or icon in SVG” is reasonable, but for “draw a complex diagram in SVG,” Mermaid or D2 is far easier.
CSS Art — Drawing Shapes with CSS Alone
CSS Art is a technique for drawing illustrations and shapes using only HTML and CSS. Without a single image file, it uses only standard CSS features — border-radius, box-shadow, pseudo-elements (::before / ::after), clip-path, linear-gradient — to produce visuals.
CodePen and similar platforms host highly intricate CSS Art, and it is popular as a skill showcase among frontend engineers.
Sample: Server Icon
<div class="server-icon"></div>

<style>
.server-icon {
  width: 60px;
  height: 80px;
  background: linear-gradient(to bottom, #e3f2fd 0%, #bbdefb 100%);
  border: 2px solid #1976d2;
  border-radius: 4px;
  position: relative;
}
.server-icon::before {
  content: '';
  position: absolute;
  top: 15px;
  left: 10px;
  width: 36px;
  height: 6px;
  background: #1976d2;
  border-radius: 2px;
  box-shadow: 0 14px 0 #1976d2, 0 28px 0 #1976d2;
}
.server-icon::after {
  content: '';
  position: absolute;
  bottom: 8px;
  right: 8px;
  width: 8px;
  height: 8px;
  background: #4caf50;
  border-radius: 50%;
}
</style>
A single div element and two pseudo-elements represent a server icon. The box-shadow trick for displaying multiple instances of the same shape is the key technique.
Sample: Architecture Diagram Layout
<div class="arch-diagram">
  <div class="arch-box client">Client</div>
  <div class="arch-arrow">→</div>
  <div class="arch-box lb">LB</div>
  <div class="arch-arrow">→</div>
  <div class="arch-group">
    <div class="arch-box app">App 1</div>
    <div class="arch-box app">App 2</div>
  </div>
  <div class="arch-arrow">→</div>
  <div class="arch-box db">DB</div>
</div>

<style>
.arch-diagram {
  display: flex;
  align-items: center;
  gap: 8px;
  font-family: monospace;
  font-size: 13px;
}
.arch-box {
  padding: 12px 16px;
  border-radius: 6px;
  border: 2px solid;
  text-align: center;
  font-weight: bold;
}
.arch-box.client { background: #e3f2fd; border-color: #1976d2; color: #1976d2; }
.arch-box.lb { background: #f3e5f5; border-color: #7b1fa2; color: #7b1fa2; }
.arch-box.app { background: #e8f5e9; border-color: #388e3c; color: #388e3c; }
.arch-box.db { background: #fff3e0; border-color: #e65100; color: #e65100; }
.arch-group { display: flex; flex-direction: column; gap: 4px; }
.arch-arrow { color: #999; font-size: 20px; }
</style>
Combining Flexbox and Grid makes simplified architecture diagram layouts possible.
Pros and Cons
No extra tools or libraries are needed whatsoever — just a browser and a text editor. Combining with Flexbox and Grid means responsive behavior comes naturally, making it useful for simple shape expressions inside UI components.
That said, I would not recommend it as a primary diagramming tool. A diagram that Mermaid or D2 would produce in 10 seconds can take 30+ minutes in CSS, so the cost-to-benefit ratio rarely makes sense. CSS Art that relies on ::before and box-shadow tricks is hard to decode even for the person who wrote it a week later — poor maintainability is something to accept going in.
AI Compatibility
Since AI is good at generating CSS, simple shapes like a server icon are achievable with “draw a server icon using only CSS.” But since CSS Art is not a primary diagramming medium, its use is honestly limited to status badges and small icons.
Canvas / p5.js — Moving and Interactive Diagrams
HTML Canvas is a mechanism for drawing pixels directly with JavaScript, and p5.js is a library that makes this more intuitive.
Where Mermaid and D2 “write text and the diagram appears,” Canvas/p5.js takes the approach of drawing diagrams programmatically. This requires more effort, but enables expressions impossible with other tools: diagrams that change dynamically based on data, animations, and interactive figures that respond to mouse input.
Sample: Flowchart-Style Diagram with Canvas API
const canvas = document.getElementById('myCanvas');
const ctx = canvas.getContext('2d');

function drawBox(x, y, w, h, text, color) {
  ctx.fillStyle = color;
  ctx.strokeStyle = '#333';
  ctx.lineWidth = 2;
  ctx.beginPath();
  ctx.roundRect(x, y, w, h, 8);
  ctx.fill();
  ctx.stroke();

  ctx.fillStyle = '#333';
  ctx.font = '14px sans-serif';
  ctx.textAlign = 'center';
  ctx.fillText(text, x + w / 2, y + h / 2 + 5);
}

function drawArrow(fromX, fromY, toX, toY) {
  ctx.strokeStyle = '#666';
  ctx.lineWidth = 2;
  ctx.beginPath();
  ctx.moveTo(fromX, fromY);
  ctx.lineTo(toX, toY);
  ctx.stroke();

  const angle = Math.atan2(toY - fromY, toX - fromX);
  ctx.beginPath();
  ctx.moveTo(toX, toY);
  ctx.lineTo(toX - 10 * Math.cos(angle - 0.3), toY - 10 * Math.sin(angle - 0.3));
  ctx.lineTo(toX - 10 * Math.cos(angle + 0.3), toY - 10 * Math.sin(angle + 0.3));
  ctx.closePath();
  ctx.fillStyle = '#666';
  ctx.fill();
}

drawBox(100, 20, 120, 50, 'User Input', '#e3f2fd');
drawArrow(160, 70, 160, 100);
drawBox(100, 100, 120, 50, 'Run Process', '#e8f5e9');
drawArrow(160, 150, 160, 180);
drawBox(100, 180, 120, 50, 'Show Results', '#fff3e0');
Sample: Data-Driven Chart with p5.js
function setup() {
  createCanvas(500, 300);
  noLoop();
}

function draw() {
  background(255);

  let data = [
    { label: 'Mermaid', value: 95, color: '#4caf50' },
    { label: 'D2', value: 80, color: '#2196f3' },
    { label: 'PlantUML', value: 75, color: '#ff9800' },
    { label: 'Graphviz', value: 70, color: '#9c27b0' },
    { label: 'SVG', value: 60, color: '#f44336' }
  ];

  let barWidth = 60;
  let gap = 20;
  let startX = 50;
  let maxHeight = 200;

  for (let i = 0; i < data.length; i++) {
    let x = startX + i * (barWidth + gap);
    let barHeight = (data[i].value / 100) * maxHeight;
    let y = 250 - barHeight;

    fill(data[i].color);
    noStroke();
    rect(x, y, barWidth, barHeight, 4, 4, 0, 0);

    fill(50);
    textAlign(CENTER);
    textSize(11);
    text(data[i].label, x + barWidth / 2, 270);
    text(data[i].value, x + barWidth / 2, y - 8);
  }
}
Changing the data array updates the chart automatically, making it suitable for dynamic data visualization.
Pros and Cons
This tool has expressive power in a completely different category from other diagram tools. Interactive diagrams that respond to mouse hover, click, and drag are uniquely possible with Canvas, and p5.js’s draw() loop enables smooth animations easily.
The trade-off is that code volume increases dramatically. A diagram that Mermaid or D2 renders in a few lines becomes tens to hundreds of lines in Canvas, and zooming in degrades image quality (unlike SVG). For static diagrams, this is overkill — but when you need interactive figures users can manipulate, or real-time animations, Canvas has its place.
AI Compatibility
JavaScript generation is one of AI’s strengths, so p5.js’s setup() / draw() pattern and basic Canvas API drawing code come out fine. However, coordinate calculations are still imprecise — elements can overlap or overflow. “Have AI generate the rough structure and manually adjust coordinates” is the realistic approach.
Selection Guide
| Your situation | Recommendation |
|---|---|
| Want to create icons or logos in code | SVG |
| Need print-quality vector images | SVG |
| Want to use shapes inside UI components | CSS Art |
| Want to reduce image files | CSS Art |
| Want to create interactive diagrams | Canvas / p5.js |
| Need animated data visualization | Canvas / p5.js |
| Want to draw diagrams quickly | → Use a general-purpose tool like Mermaid |
Practical Tips: SVG Optimization
SVG files output by AI or other tools often contain unnecessary metadata and redundant attributes. Running them through SVGO (SVG Optimizer) can reduce file size by 30–70%.
npm install -g svgo
svgo input.svg -o output.svg
SVG output from Mermaid CLI or Graphviz in particular tends to have significant room for optimization — running SVGO before deploying to production speeds up page loading. Integrating it into CI/CD for automatic optimization is also a good approach.
Installation
SVG
SVG is a standard technology requiring no special installation. Create a .svg file in any text editor and open it in a browser. It can also be embedded inline in HTML.
<!-- Inline SVG -->
<svg width="100" height="100">
  <circle cx="50" cy="50" r="40" fill="blue"/>
</svg>

<!-- External file reference -->
<img src="diagram.svg" alt="diagram" />
CSS Art
No special installation required. Just write CSS in an HTML file.
Canvas / p5.js
The Canvas API is HTML5 standard with no extra installation. For p5.js, load from a CDN:
<script src="https://cdn.jsdelivr.net/npm/p5@1/lib/p5.min.js"></script>
<script>
function setup() { createCanvas(500, 400); }
function draw() { background(220); ellipse(mouseX, mouseY, 50, 50); }
</script>
Related Articles
Summary
This article compared 3 vector and direct-drawing tools as code-manageable visualizations for the AI era.
To be frank, these 3 are not “primary tools for drawing diagrams.” The code volume is incomparably higher than Mermaid or D2, so they are not suited for everyday use. Yet the expressive power afforded by being web-standard technologies cannot be replicated by other tools.
SVG shines as an “output format” combined with other tools; CSS Art has its place for “shape expressions inside UI components”; Canvas/p5.js is the choice for “interactive and dynamic diagrams”.
Next up: Text Art tools — ASCII Art, Ditaa, and Svgbob.
Series Index → Complete Guide to Diagrams in the AI Era
For further details, see the official sites: MDN SVG / MDN CSS / p5.js
Thank you for reading. We hope to see you in the next article.