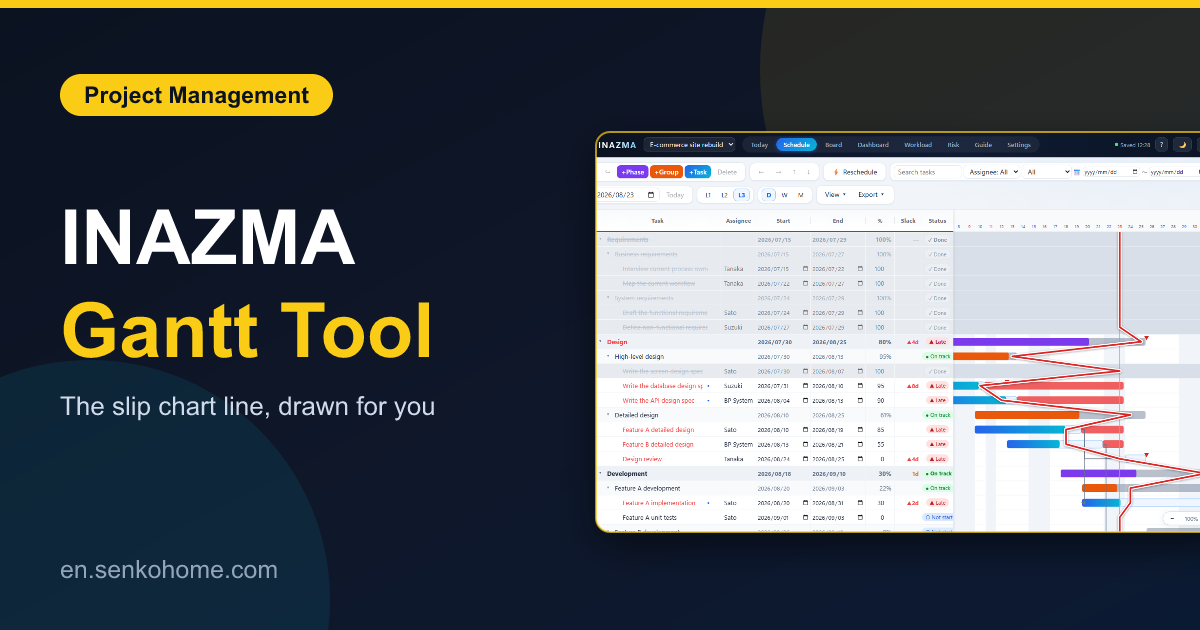
Thank you for visiting the site. This article is about “INAZMA”, a free scheduling tool I built to replace the Excel Gantt chart, with one question at its centre: where, exactly, is this project behind?
I have run a fair number of projects on Excel schedules. They are fine until the third week, when the percentages are out of date, nobody can tell which delay matters, and the status meeting turns into people reading rows aloud. What I wanted was a schedule that answered the “where are we behind” question by itself, every morning, without anyone having to maintain a formula.
It opens in English on its own, sample project included, so there is nothing to switch. Further down that page there is a description of the tool in Japanese as well as English, which is only there for search engines.
⚡ Open INAZMA (free)No sign-up, runs in the browser. Your schedule never leaves your device
The Line That Gives It Its Name
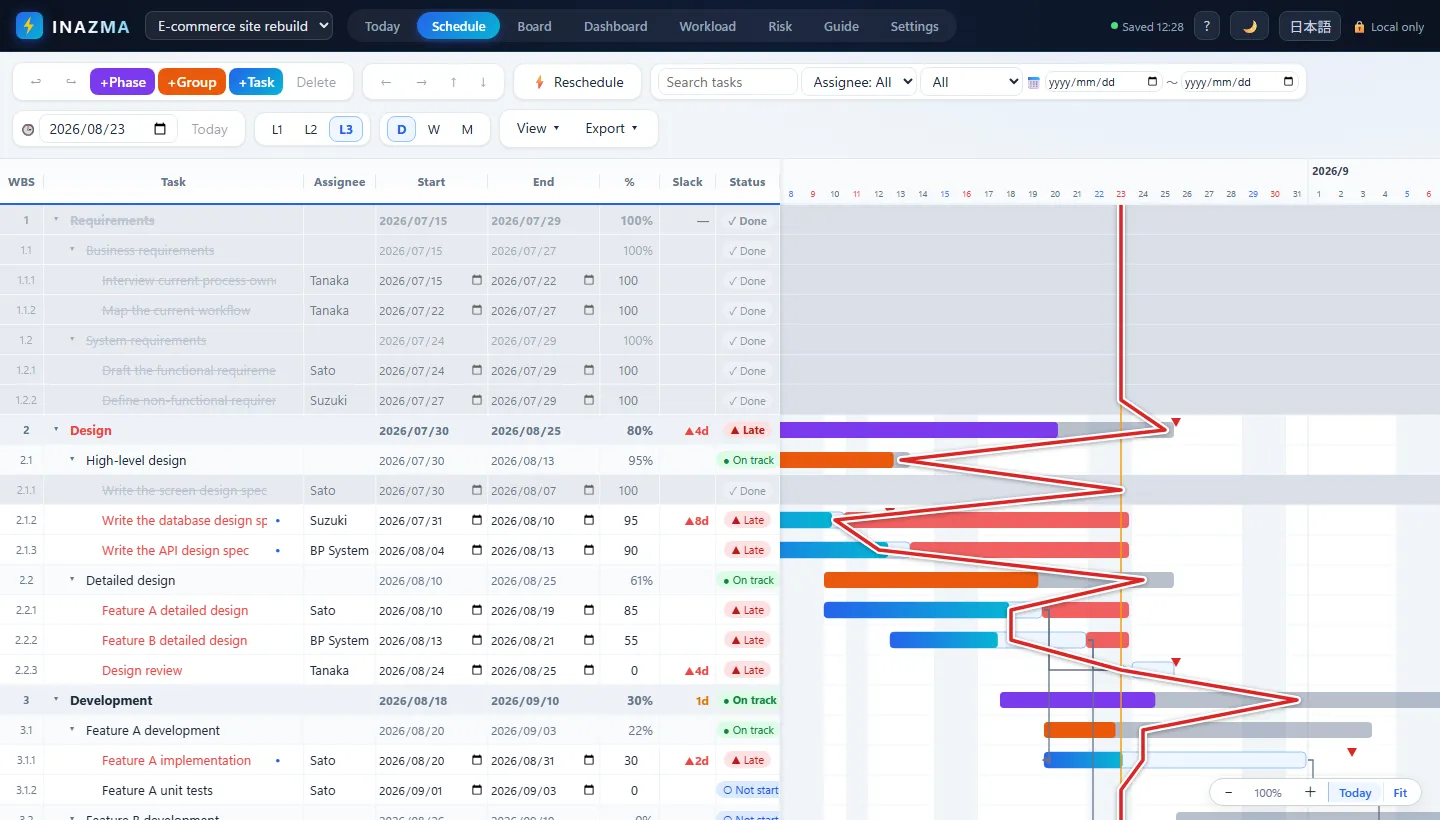
The Japanese name for a slip chart line is inazuma-sen, a “lightning line”. It is a polyline drawn down a Gantt chart from the status date, bending left on every task that is behind and right on every task that is ahead. One glance at the chart tells the whole room where the trouble is, which is why it has been used on Japanese construction and software projects for decades.
INAZMA draws that line for you. You enter percentages, and it “computes the line on working days”, skipping weekends, Japanese public holidays and any non-working days you define. It takes a snapshot every day, so you can slide back through past lines and see whether a delay is widening or being recovered, and you can overlay last week’s line as a comparison.
I wrote a separate article on how to read and draw the line by hand, if the idea is new to you.

What Else Is In It
The slip chart line is the reason it exists, but to be a schedule it has to do the ordinary things well, and the list ended up longer than I expected.
- A nested WBS of phases, tickets and tasks. Parent dates and progress roll up from children, weighted by working days
- Dependencies by WBS number, with arrows on the chart and the “critical path” highlighted. Lags like
2.1+3are supported - A one-click reschedule that pushes successors back when a predecessor slips (never forward), with undo
- A baseline you can save and show as faint bars under the current plan
- Deadlines kept separately from planned finish, so that “float”, the working days of slack left to each deadline, is computed from the forecast rather than the plan
- A kanban view of leaf tasks, a resource load chart with a capacity line, and a heatmap of who is overloaded in the weeks ahead
- A risk register with a likelihood × impact matrix
- A weekly report generated as Markdown, and a report pack (Gantt PNG plus reports) in one ZIP
- Templates to start from: a waterfall system build, a scrum project, a website build, an event
The grid edits like a spreadsheet: Enter adds a row, Alt plus the arrows changes level or moves rows, and “pasting a cell range from Excel” just works, which is how most people migrate an existing schedule in about a minute.
Where the Data Lives
In your browser, and nowhere else. There is no server, no account, and nothing is uploaded. You can export to JSON, CSV or Markdown, and the Markdown round-trips, so a schedule can live in a Git repository or an Obsidian vault and be opened directly from a file with Ctrl+S to save back. Jira CSV exports can be imported. If you need to show a schedule to someone, a read-only link compresses the whole project into the URL, no server involved.
It installs as a PWA and works offline, switches between Japanese and English, and has a dark mode. A few things are deliberately left out: there is no timesheet or actual-hours tracking, because that input cost is exactly what makes people stop updating their schedules.
Summary
This article introduced INAZMA.
It is a Gantt tool whose central feature is a line that shows where the schedule is behind, drawn automatically on working days and kept as a history, with the rest of a scheduling tool built around it and no server anywhere. If your project lives in an Excel sheet that nobody trusts any more, I think this is worth ten minutes with a pasted copy.
Why Excel schedules break down in the first place is covered here.

I hope you will read the next article as well.
Also popular with readers
📚 Series: Free Browser Apps I Built (7/11)