Thank you for visiting this site. This article covers “The False Positive Paradox.”
Receiving a “positive” result on a medical test is naturally alarming. But even with a test that is 99% accurate, a positive result may mean the actual probability of having the disease is well below 50%. This is not mathematical sleight of hand — it is a hard fact of probability theory.
A Concrete Example
A famous survey conducted at Harvard Medical School posed a similar problem to doctors and medical students. About half gave the wrong answer — a trap that even experts fall into.
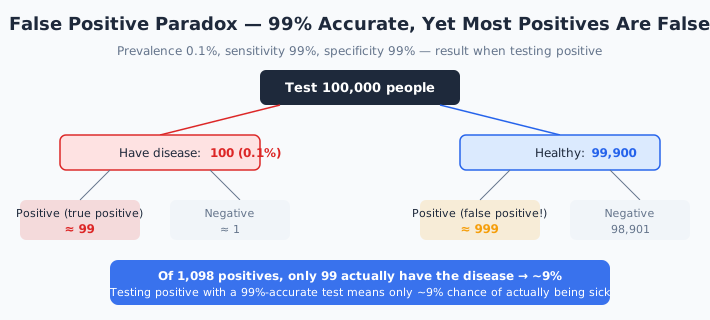
Suppose a disease has a prevalence of 0.1% (1 in 1,000 people). The test has these properties:
- Probability of correctly identifying a sick person as positive (sensitivity): 99%
- Probability of correctly identifying a healthy person as negative (specificity): 99%
At first glance this seems like an excellent test. But let’s look at what happens when 10,000 people are tested.
Of the 10,000 people, 10 have the disease (0.1%) and 9,990 are healthy.
Of the 10 sick people, 9 are correctly identified as positive (sensitivity 99%). Of the 9,990 healthy people, 100 are incorrectly identified as positive (1% false positive rate).
Total positive results: 9 + 100 = 109. Of those, only 9 actually have the disease.
The probability of actually having the disease after testing positive is only 9 ÷ 109 ≈ about 9%.
(Note: the diagram uses the rounded figures of 10 true positives and 100 false positives for clarity.)
Why Does This Happen?
The key is the low prevalence of the disease.
Because the disease is rare, the vast majority of people being tested are healthy. Even a 99%-accurate test incorrectly flags 1% of healthy people as positive. The 1% of the overwhelming majority of healthy people swamps the small number of true positives.
This demonstrates that the prior probability (prevalence) fundamentally shapes how results should be interpreted. Looking only at test accuracy is insufficient for a correct judgment.
There is an intuitive way to think about this. Before testing, the probability that you have the disease is only 0.1%. No matter what the test shows, you start from that very low baseline. A 99% accurate test provides strong evidence — but it is not enough to overcome a starting point as low as 0.1%.
Bayes’ Theorem
The mathematics behind this paradox is Bayes’ theorem.
The probability of actually having the disease after a positive result (positive predictive value) must be calculated taking into account not just test accuracy but also prevalence. The rarer the disease, the higher the chance that a positive result is a false positive.
Conversely, for a disease with high prevalence (say, 50%), a positive result from a 99%-accurate test would mean more than a 99% probability of actually having the disease. The same test means something entirely different depending on the population being tested.
Real-World Impact
This paradox has a significant impact on real healthcare.
Large-scale screening programs face exactly this problem. Testing large numbers of healthy people produces many false positives, leading to unnecessary follow-up tests and anxiety. This is one reason why some screening programs target only high-risk populations.
During the COVID-19 pandemic, the value of mass testing of asymptomatic people was actively debated through this lens. Interpreting results correctly requires knowing the infection rate in the tested population, not just the test accuracy.
Three ways to make a positive result mean more
If a positive result is less trustworthy the rarer the disease, what can be done? There are three levers.
- Narrow the population tested: screen by symptoms, age or family history before testing, raising the prevalence itself
- Raise the specificity: reduce false positives. This does more than raising sensitivity
- Stack tests: combine tests working on different principles and call a result positive only when both are
The second is the surprising one. For a rare disease, specificity matters far more than sensitivity.
At a prevalence of 0.1%, only 100 people in 100,000 have the disease. Raising sensitivity from 99% to 100% catches one more of them. Raising specificity from 99% to 99.9%, meanwhile, cuts false positives from 999 to about 100.
The denominators differ by orders of magnitude, so it is the ability to correctly exclude healthy people that drives the result.
The third lever is powerful too. Put a sample through two tests with unrelated mechanisms and false positives fall multiplicatively. If each misfires 1% of the time, both misfiring has probability one in ten thousand.
Running a simple test at population screening and a detailed test only on those who come back positive uses the first and third levers together. “Narrow first, then stack” is more efficient than “a highly accurate test for everybody”.
Beyond Medicine
The False Positive Paradox applies well beyond healthcare.
Terrorist detection: Even if an airport facial recognition system can detect terrorists with 99.9% accuracy, if there is only one terrorist among a million passengers, the vast majority of alerts will be false. Hundreds of innocent people are wrongly flagged, creating chaos.
Spam filters: Even a highly accurate spam filter will incorrectly classify a meaningful number of legitimate emails as spam when legitimate messages vastly outnumber spam.
Court evidence: If a DNA match is reported as a 1-in-a-million probability, but the suspect pool was drawn from an entire large city’s population, the meaning of that “match” is very different from what intuition suggests.
The Power of Retesting
The most practical remedy for the False Positive Paradox is retesting. Consider what happens if a person who tested positive takes the test a second time.
The first positive result raised the probability of having the disease from 0.1% to about 9%. Using this 9% as the new prior, if the second test also comes back positive, the probability of actually having the disease jumps to approximately 91%. This is the logical foundation for confirmatory (secondary) testing.
Change the prevalence and the conclusion changes
What drives this problem is not the accuracy of the test but how rare the disease is.
Positive predictive value by prevalence
Here is the same test — 99% sensitivity, 99% specificity — applied with only the prevalence varied. The figures assume the same 10,000 people tested as above.
| Prevalence | True positives | False positives | Share of positives that are real |
|---|---|---|---|
| 0.01% (1 in 10,000) | about 1 | about 100 | about 1.0% |
| 0.1% (1 in 1,000) | about 10 | about 100 | about 9.0% |
| 1% (1 in 100) | about 99 | about 99 | about 50.0% |
| 10% | about 990 | about 90 | about 91.7% |
| 50% | about 4,950 | about 50 | about 99.0% |
Nothing about the test’s performance has changed, and the meaning of a positive moves from 1% to 99%.
A prevalence of 1% is the crossover, where it comes out exactly even. For anything rarer, a positive result is wrong more often than it is right.
Sorting out the terms
This field has a lot of similar-sounding words, so it helps to pin down the correspondences.
- Sensitivity: the share of diseased people correctly called positive. How rarely it misses
- Specificity: the share of healthy people correctly called negative. How rarely it misfires
- Positive predictive value: the share of positives who really have the disease. Governed by prevalence
- Negative predictive value: the share of negatives who really are healthy. For a rare disease it is near 100%
Sensitivity and positive predictive value are the pair most often confused. What is being advertised as a “99% accurate test” is the former; what the person taking it wants to know is the latter.
The former is a property of the test and does not depend on prevalence. The latter varies by orders of magnitude with the population tested, for one and the same test.
That distinction is also why screening and confirmatory testing are separated. Narrow the population with a simple test first, then apply the detailed test to a group whose prevalence is now higher. Read as a procedure for moving down the table above, the two-stage design makes immediate sense.
Think in people, not in percentages
Problems of this kind are known to be hard to follow when explained in probabilities and much easier when converted into actual head counts.
The following two statements say the same thing.
- In probabilities: at a prevalence of 0.1% with 99% sensitivity and 99% specificity, the positive predictive value is about 9%
- In people: 10 people in 10,000 have the disease, and about 10 of them test positive. Of the 9,990 healthy people, about 100 also test positive. Of the 110 positives in total, 10 really have the disease
With the second, the fact that the healthy denominator is orders of magnitude larger is visible at a glance.
The psychologist Gerd Gigerenzer confirmed the effect in surveys of doctors. Posed in probabilities the accuracy rate was low; posed in what he calls natural frequencies — head counts — it improved markedly.
- A probability has been through a division, so information about the original denominator is gone
- A head count keeps the denominator, so the comparison can be made visually
The same applies to explanations in a clinic and to sharing figures inside a company. The moment something is converted to a percentage, the most important denominator disappears. Simply printing the underlying counts alongside removes a great deal of misunderstanding.
From the point of view of somebody being tested, the greater problem is being handed a positive result without being told the prior probability. The same word means entirely different things without it.
Related paradoxes that defy probabilistic intuition
Related paradoxes where the arithmetic is correct and the answer refuses to sit with intuition.



Summary
This article covered “The False Positive Paradox.”
Even highly accurate tests produce many false positives when testing for rare diseases — a fact that runs counter to intuition. Understanding numbers correctly requires Bayesian thinking, as this paradox vividly illustrates.
To return to the full list of paradoxes, follow the link below.
Thank you for reading. We hope to see you in the next article.

Also popular with readers
📚 Series: The World's Paradoxes (35/81)