Thank you for visiting this site. This article covers “base rate neglect.”
Consider this person: “shy and meticulous; enjoys reading and math puzzles; prefers tinkering with machines to talking with people.” Which is their job — librarian, or salesperson? Most people answer “librarian” instantly. But salespeople outnumber librarians by hundreds to one. However librarian-like the sketch, the sheer difference in headcount should easily push back. The habit of ignoring that headcount is base rate neglect.
What Is Base Rate Neglect?
Base rate neglect is the tendency to ignore prior information about proportions in the population (the base rate) and judge probability from the individual features and impressions in front of you.
Base rates are “foundation numbers” like:
- The ratio of salespeople to librarians
- A disease’s prevalence (1 in 10,000, etc.)
- The survival rate of startups
- The gender ratio within an occupation
Rational probability judgment should build individual evidence on top of the base-rate foundation (statisticians call this Bayesian inference). But human intuition, the instant it spots individual evidence — especially “resemblance to the type” — forgets the foundation exists.
The Lawyer-Engineer Experiment
The classic demonstration is Kahneman and Tversky’s 1973 “lawyer-engineer problem.”
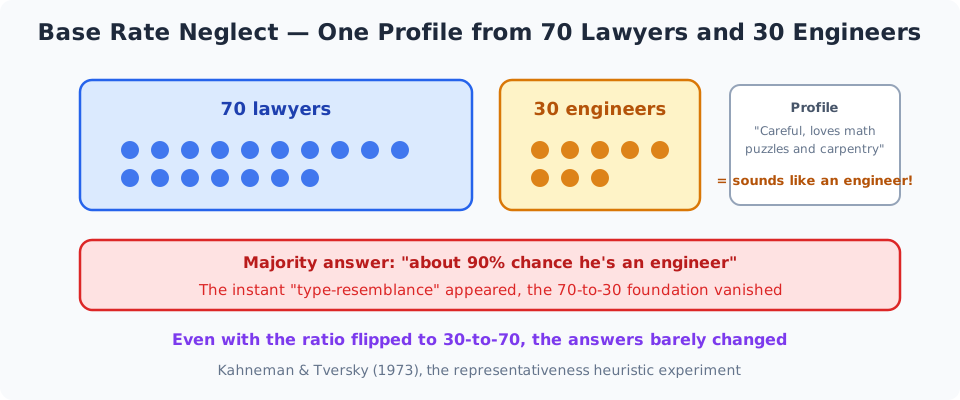
Participants were told: “Here are profiles of 100 people — 70 lawyers and 30 engineers. One profile was drawn at random.” Then they read something like:
Jack is a 45-year-old man, married with four children. Conservative, careful, and ambitious. He has no interest in politics or social issues and spends most of his free time on carpentry, sailing, and mathematical puzzles.
“What is the probability that Jack is an engineer?”
Most participants said around 90% — because the profile is so “engineer-like.” But engineers make up only 30% of the deck. Even granting the resemblance, the reasoning should start from that 30% foundation. Instead, answers almost completely ignored the base rate and were driven by the impression alone.
The decisive comparison: a group told 70 lawyers/30 engineers and a group told the reverse (30/70) gave nearly identical answers. The moment a “type-fitting description” appears, the 7-to-3 foundation vanishes from the judgment. Kahneman and Tversky named the mechanism the “representativeness heuristic” — judging probability by degree of resemblance. The more Jack’s sketch resembles “the typical engineer,” the more probable it feels.
Even better: when the profile was replaced with “a vacuous description carrying no clues at all,” participants answered fifty-fifty. With no information, the base rate should be the answer — yet even meaningless information was enough to evict it.
The Taxi Problem: How Much Can a Witness Be Trusted?
To feel the base rate’s power one level deeper, take the “taxi problem,” also used by Kahneman and colleagues.
In a city, 85% of taxis belong to the Green company and 15% to the Blue company. One night there is a hit-and-run, and a witness testifies, “it was a Blue taxi.” Testing shows the witness identifies colors correctly 80% of the time under night conditions and confuses them 20% of the time. What is the probability the culprit really was a Blue taxi?
Intuition wants to say “the witness is 80% accurate, so about 80%.” Fold in the base rate, and the answer transforms.
Count through 100 taxis:
- Blue taxis: 15. The witness correctly calls 12 of them (80%) “blue”
- Green taxis: 85. The witness wrongly calls 17 of them (20%) “blue”
“It was blue” gets said in 29 cases total, of which only 12 are really blue. So the probability the testimony is right is 12 ÷ 29 ≈ 41% — not 80%, but less than half.
Because Blue taxis are rare to begin with, the absolute number of “green mistaken for blue” cases outweighs the “blue seen correctly” cases. That is the base rate’s muscle: 80%-accurate testimony flips easily when the base rate is lopsided. The structure is identical to this blog’s “false positive paradox” (a positive result on a 99%-accurate test still may not mean disease) — that article is the medical edition of base rate neglect.
Search-Engine Self-Diagnosis, Hiring, and Profiling
Googling your symptoms is base rate neglect’s modern hotspot. Search a headache and grave diagnoses fill the page. When your symptoms “match the list well,” the disease feels probable. But an ordinary headache and a rare disease differ in base rate by orders of magnitude. The “match” may be identical while the foundations are worlds apart. When doctors “rule out the common causes first,” they are being faithful to base rates — statistically correct behavior.
Hiring and personnel judgments run on it too. The representativeness of “impressive interview answers” overwrites the base rate of “how many people with this background actually performed.” This is exactly where it merges with the halo effect and stereotyping.
Fascination with rare success stories shares the structure. The narrative pull of “dropped out, founded a company, triumphed” has nothing to do with the base rate of success among dropout founders. “Check the denominator” from the survivorship bias article is precisely the act of checking a base rate.
Profiling and prejudice follow. Inference from “the culprit must fit this profile” becomes a factory for false accusations the moment it ignores the base rate — how many tens of thousands of innocent people also fit the profile.
The Fix: Think in a Village of 10,000
The most practical countermeasure is thinking in “natural frequencies.” Drop the percentages and translate everything into headcounts: “out of 10,000 people, how many?”
As the taxi problem showed, recounting as “out of 100 taxis…” reaches the right answer without ever invoking Bayes’ theorem. Psychologist Gerd Gigerenzer’s research confirms that presenting the same problem in natural frequencies dramatically raises accuracy — for physicians and laypeople alike. The brain fumbles “multiplying percentages” but handles “counting heads” just fine.
The daily checklist:
- When something “fits the type,” first ask: “how many in the whole population — 1 in what?”
- Before leaping to the rare possibility (grave disease, huge success, conspiracy), compare its base rate against the “boring explanation”
- Translate headlines like “risk doubles” into “1 in how many became 1 in how many” (doubling may mean 1 in 100,000 became 2 in 100,000)
- Whenever you see a test’s accuracy figure, recall the taxi problem and count the absolute number of false positives
The False Positive Paradox and How to Guard Against It
How Does This Relate to the False Positive Paradox?
Same phenomenon, different cross-section. The false positive paradox (a positive result on a 99%-accurate test may mean only a few percent chance of disease when prevalence is low) is base rate neglect in the context of medical testing. The lawyer-engineer and taxi problems are the general form. The full arithmetic lives in the false positive paradox article, if you want to trace “how 99% gets overturned” in numbers. The mechanism is one and the same: with a lopsided base rate, the majority side’s “mistakes” outnumber the minority side’s genuine cases in absolute terms.
Do I Need Bayes’ Theorem to Protect Myself?
No — that is the good news. The natural-frequency method — “counting in the village of 10,000” — reaches the same answer as Bayesian inference with no formula. Three steps: ① set the population at 10,000 (or 100); ② split it by the base rate into “affected / not affected”; ③ for each side, count “how many the evidence would flag,” then take the ratio. That is exactly the taxi calculation. Rather than memorizing an equation, install the reflex: “see a percentage — convert to headcount.” In real life it serves far better.
What If the Stereotype Is Statistically Accurate?
A delicate but important question. To sort it out: the error in representativeness reasoning is not “using group tendencies” per se — it is ignoring base rates, and pronouncing verdicts on individuals from group averages. Even when a tendency is statistically real, nothing guarantees the person in front of you follows it; and in judgments that shape individual lives — hiring, credit, justice — judging a person by group statistics raises fairness problems regardless of statistical accuracy (which is why many jurisdictions regulate attribute-based discrimination irrespective of the underlying stats). Use statistics for “policy about groups”; judge “individuals” by their own record and conduct. That division, I believe, is the realistic answer that keeps statistical literacy and fairness in the same room.
Related Cognitive Biases
See the “false positive paradox” (this article’s medical edition), “survivorship bias” (the shared failure to check denominators), and the “availability heuristic” (another case of impressions overwriting probability).
Summary
This article covered “base rate neglect.”
Before an “engineer-like” profile, the numbers 70-to-30 evaporated. Under the base rate, an 80%-accurate eyewitness shrank to 41%. “Fitting the type” shines brightly enough to erase the statistical foundation entirely.
See a percentage? Recount it in the village of 10,000. Meet a story that fits the type? First check the foundation: “1 person in how many are we talking about?” That small extra step is, I believe, the most cost-effective armor available for surviving the modern flood of plausible-sounding information — from search-engine self-diagnoses to investment pitches.
To return to the full list of cognitive biases, follow the link below.
Thank you for reading. We hope to see you in the next article.
Also popular with readers
📚 Series: Cognitive Bias Guide (25/26)