Thank you for visiting this site. This article covers “regression to the mean” — and our blindness to it.
You praise a subordinate, and their next piece of work slips. You scold them harshly, and the next one improves dramatically. Repeat this a few times and the manager’s brain carves in a rule: “praise breeds complacency; criticism works.” A thoroughly persuasive-looking conclusion. Except — what if even if praise and criticism had zero effect whatsoever, pure statistics would guarantee things look exactly this way? That machinery is “regression to the mean.”
What Is Regression to the Mean?
Regression to the mean is the statistical phenomenon whereby, across repeated measurements, an extremely good (or bad) result tends to be followed by a result closer to the average.
Why? The key is that almost every outcome in life is “skill + luck.”
Take a test score. A 90 is a result that likely reflects high skill plus a tailwind of luck — the topics you studied came up, your health was good, the problems suited you. The more extreme the result, the more likely luck contributed alongside skill.
And luck does not promise to blow again next time. Skill stays put, but the luck component alone drifts back to average. So after a 90 comes an 85 or an 80. Conversely, after a luck-forsaken 40, the next score climbs back toward true skill. Regression to the mean is, honestly, nothing more than that.
What matters is that this is not a phenomenon caused by anyone doing anything. Do nothing at all, and extremes are still followed by average. Miss this, and — as the next story shows — you will invent a “cause” for what was only a swing.
The Flight Instructors’ Illusion Kahneman Encountered
The most famous telling of this blindness is Daniel Kahneman’s own experience with flight instructors in the Israeli Air Force.
When Kahneman lectured the instructors on the psychological finding that “praise teaches better than punishment,” a veteran instructor pushed back hard:
“In my experience it’s the opposite. Praise a cadet for a beautiful maneuver, and the next one is invariably worse. Scream at a cadet for a terrible maneuver, and the next one invariably improves. Praise doesn’t work; punishment does.”
The instructor’s observations were factually accurate. But Kahneman realized he was looking at regression to the mean itself:
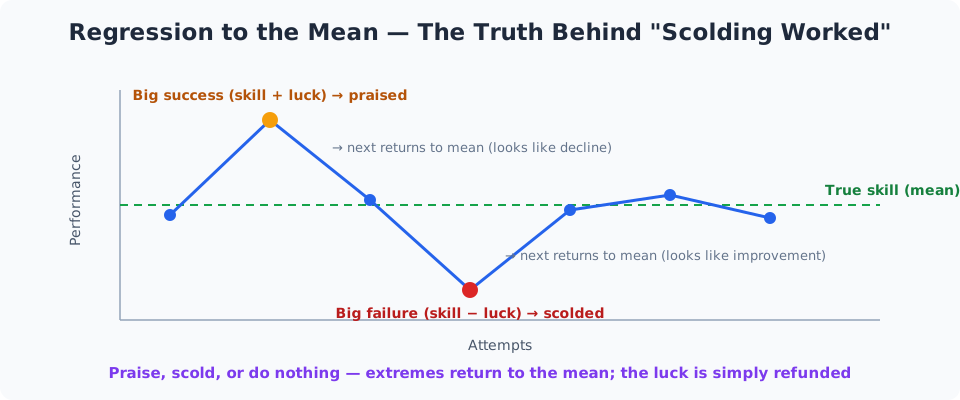
- A “beautiful maneuver” is an extreme result — skill plus a bonus of luck → the luck peels away and the next attempt returns to average (looks like decline)
- A “terrible maneuver” is an extreme result — skill minus luck → the luck returns and the next attempt climbs to average (looks like improvement)
In other words, praise, scold, or do nothing — after an extreme flight, the next one regresses to the mean. Yet the instructor, seeing only the dip after praise and the rebound after scolding, had invented a causal law: “scolding works.”
Kahneman retold this episode all his life as a joyous moment of insight — and a dark one. The people we praise get worse; the people we punish get better. The very structure of statistics keeps teaching every instructor on Earth the false lesson that punishment beats reward.
The Sophomore Slump, the Cover Jinx, and Monday’s Miracle Cure
Regression to the mean travels under many aliases.
The sophomore slump is the flagship. A rookie who dazzles in year one and turns ordinary in year two gets explained by “opponents adjusted” or “success went to their head.” Those factors may exist — but statistics alone explains most of it. “A standout rookie season” is an extreme result: skill with luck stacked on top. Peel off the luck and year two shows the skill as it is. Only players whose rookie year was too good for regression to explain remain stars in year two.
The magazine cover jinx is the same. Athletes who grace a sports magazine’s cover then slump — a “curse” reported in many countries. But you get chosen for the cover at your absolute peak, i.e., the extreme stretch when luck was riding with you. The ensuing return to average is not a curse; it is statistics.
Folk remedies show the harmful version. People try a remedy when symptoms are at their worst. Most symptoms wave naturally, so after the worst point, improvement follows no matter what you do (or don’t). Whatever remedy happened to be in hand gets credited. This structure is one reason testimonials for ineffective treatments never run dry.
Business initiative reviews trip on it constantly. Launch a turnaround plan in the worst sales month and next month’s recovery is practically guaranteed (the worst is followed by the average). Install countermeasures at an “accident-prone” intersection and accidents fall (the “prone” label itself encoded a luck-streak). “An initiative launched at rock bottom looks effective even at zero effect.” Organizations that don’t know this trap keep archiving useless initiatives as success stories.
How Is This Different from the Gambler’s Fallacy?
Since both involve “swings back,” the two are easily confused. The sorting:
- Gambler’s fallacy: expecting a swing back — “the opposite is due” — in pure-luck, independent trials like coin flips → an error (the coin has no memory; there is no mechanism to swing back)
- Regression to the mean: in skill-plus-luck outcomes like test scores, extremes tend to be followed by average-ish results → a correct statistical phenomenon (only the luck component returns to average)
So the intuition “it will come back” is wrong for pure luck, right for skill-plus-luck.
Annoyingly, the failure modes run in both directions. Say “tails is due” about coin flips — gambler’s fallacy. Say “my scolding did it” about a test-score rebound — regression blindness. The first believes in a swing that doesn’t exist; the second pastes a false cause onto a swing that does. Learn them as a pair and your probability intuition levels up.
The Fix: Ask “What Would Have Happened Anyway?”
The countermeasure for regression blindness is the foundation of all program evaluation.
- Seeing a change right after an extreme result, first ask: “would this have returned to average with no intervention at all?”
- Measure an initiative’s effect as the difference between “the treated group” and “an untouched comparison (control) group”
- When the story is “things were at their worst, so we acted,” heavily discount the subsequent improvement as evidence
- Build the habit of estimating “how much of this result is luck” (the luckier the domain, the bigger the regression)
The control-group idea is the essential antidote. Drug trials always include a “no-drug comparison group” precisely to separate natural recovery (which includes regression) from the drug’s effect. In business too, preserving A/B tests or a “deliberately untouched comparison” wherever possible is your defensive line against budgets being drained forever by initiatives that merely look effective.
At the personal level: don’t over-interpret the slump after a hot streak or the recovery after rock bottom. Most slumps are not skill decaying — they are the return of luck borrowed during the good times.
The Name’s Origin, and Telling Regression from Real Decline
Where Does the Word “Regression” Come From?
From the 19th-century scientist Francis Galton’s studies of parent and child heights. Galton found that very tall parents tend to have children shorter than themselves, and very short parents, children taller — a pattern he called “regression toward mediocrity.” Height reflects inheritance (the “skill” analog) plus chance factors (the “luck” analog), so parental extremes don’t transmit whole. The analytical method born in this research later grew into the central technique of statistics — “regression analysis.” Behind the intimidating name lies the humble observation that children’s heights drift back to average.
How Do I Tell Regression from an Actual Drop in Ability?
The honest answer: a single result cannot tell you. The only discriminator is the average across multiple results. One collapsed test is explicable by regression; five straight slumps signal a genuine change worth investigating. In practice, pre-commit to a rule — “never intervene on one bad result; intervene when the trend persists” — and you reduce both overreaction to regression and blindness to real decline. The luckier the domain (sales numbers, investing, sports), the more results you should require before judging.
So How Should I Actually Coach Subordinates and Kids?
This is the flight instructor story, applied. First: do not interpret “improvement right after scolding” as the scolding’s effect. That rebound was statistically promised and would likely have happened whatever was said. Beyond that, the accumulated psychology says long-run improvement is built on good feedback and practice design, not punishment. My recommendation: respond mildly to extreme outcomes (triumphs and disasters alike) and aim your words at the process — the improvement of average, repeatable behavior. Outcomes are shaken by luck; process is the part that belongs to the person.
Related Cognitive Biases
Learn it paired with the “gambler’s fallacy”; see also “hindsight bias” (which drapes narratives over swings) and “survivorship bias” (the testimonial trap).
Summary
This article covered “regression to the mean” and our blindness to it.
Praise, and they get worse; scold, and they get better. As raw observation this rule is accurate — which is exactly what makes it treacherous. The structure of statistics itself keeps distributing the false lesson “punishment works” to instructors everywhere. That is why Kahneman called it a lesson for life.
Ask yourself: “what would have happened if I had done nothing?” When change follows an extreme, suspect the statistical swing before hunting for causes. People who can manage this one extra step quietly free themselves from ineffective initiatives — and from a great deal of needless self-blame.
With this, all 25 articles of the cognitive bias series are complete. The full series is available from the index below.
To return to the full list of cognitive biases, follow the link below.
Thank you for reading. We hope to see you in the next article.
Also popular with readers
📚 Series: Cognitive Bias Guide (26/26)